


Bear Market Rally and Big Tech Implosion
Bear Market Rally and Big Tech Implosion
What we're seeing right now

While 2022 has been a painful year for most investors, we believe the current bear market is far from over and as we mentioned in our previous posts we expect to see much lower lows for stocks and housing prices along with continued inflation and rising unemployment in 2023.
Fortunately, we are finding that our patience continues to pay off as our large cash position not only serves to reduce portfolio volatility but also allows us to add to our favorite stocks on pullbacks in price. Inline with our risk-management guidelines we continue to build solid positions in great companies. The idea is that our cash position will get smaller as the bear market comes to an end at some point down the road. Once again, patience is key.
While we generally still see the US consumer as being in relatively good shape with unemployment still quite low, by mid-2023 we expect the US economy to start rolling over as the housing market continues to weaken, corporate layoffs begin to mount, and the consumer pulls back due to job losses and inflation. Some of this is already priced into stocks, though we believe the broader US indexes have further to fall next year.
That said, with the FOMC (the Fed) likely pausing their interest rate hiking cycle after one final hike next Wednesday, we may see the current bear market rally continue for some time.
As always, we will let the charts be our guide along this journey.
US STOCKS: Bear market rally and big tech implosion
As stated above, we are currently in the midst of a bear market rally in stocks which may last a few more days, weeks, or perhaps even months - the timing itself is of no real concern to us. What’s important is knowing where we are in the overall cycle so that we can make good decisions to reduce risk and seize opportunities as they arise.
While we feel great about all of our equity positions, it is important to understand that the stock market is structured in such a way that all stocks generally move with some correlation to the S&P 500. As an analogy, think of small boats in the ocean tossed about in the wake of a large cruise ship passing by — the boats ride up and down with some correlation to the big ship. Now imagine the small boats are stocks and the cruise ship is the S&P 500. Due in part to the extreme overuse of passive investing, as the S&P goes so go most stocks in its wake.
With that in mind, below are a couple charts to give you an idea of where we are in the larger stock market cycle.
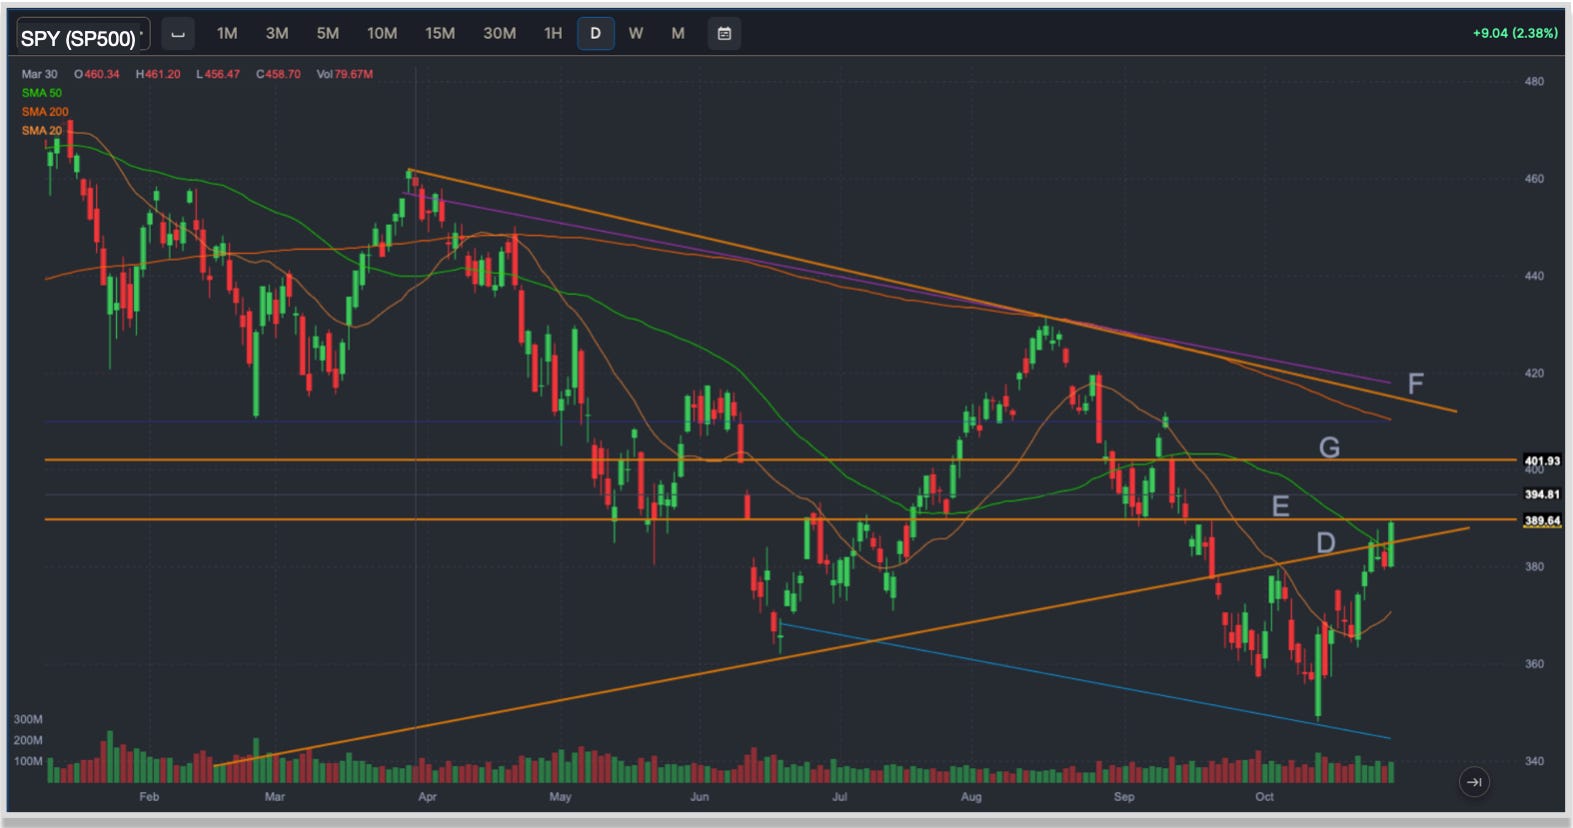
Illustration 1 is a daily chart of the S&P 500 (SPY). Each of the lines labeled D-G are resistance points on the chart. As of now, the SPY is touching E. As the current up-trend continues, we will look to take gains where appropriate and perhaps add to our short positions if the opportunity presents itself. The chart here suggests a potential max upside of about 400 on the SPY which is in the neighborhood of 4100 for the S&P 500. As always, we just watch the charts and take it one day at a time.
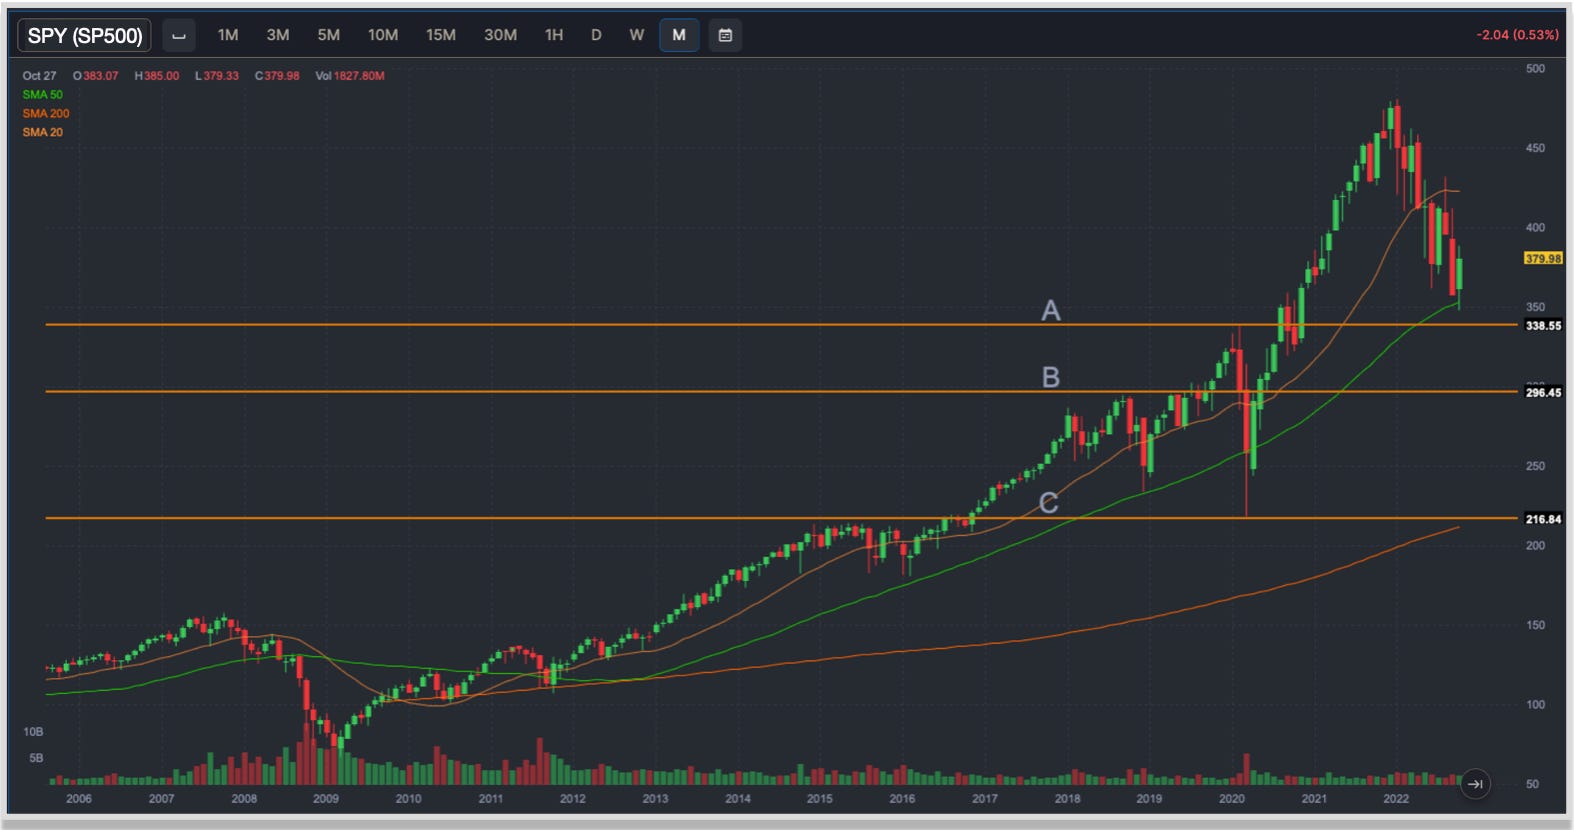
Ultimately we are looking for stocks to head lower over time. In Illustration 2 we see a few lines of support that may represent logical inflection points for the S&P 500. Note that line A represents a drop of about 11% from the current level, line B about 22% lower, and line C about 42% lower than we are today. All these levels are well within the range of what we would consider a potential pullback and may create vast opportunities to invest down the road.
Last week was a wild one for some of the biggest names in US stocks. Taking a beating on earnings announcements were Microsoft, Google, Meta (Facebook) and Amazon. Here are the moves that occurred on the open market immediately following their earnings reports: Google -9.1%, Microsoft -8.2%, Meta -23.8%, AMZN -12.2%.
In total, those 4 stocks alone represent a market cap of more than $4 trillion; imagine the money lost in just those four names last week. You can see in Illustration 3 how significant the recent selloff has been among the big tech names.

Amazon has dropped to levels of 2018, Meta to 2016, Google to late 2020, and Microsoft to mid-2020. We believe that both Microsoft and Google have further to fall before this bear market is over — and then there’s Apple which is only about 14% off it’s all-time high from January 4 of this year. Apple is the world’s largest stock weighting in at $2.6 trillion. When this stock finally falls it will likely take the rest of the market down with it.
Given the broad selloff in stocks, the fact that interest rate hikes take months to work themselves into the economy, and the weakness in the housing market we expect the Fed to announce a pause in their interest rate hiking cycle after adjusting their target overnight lending rate by another 75bps (0.75%) on Wednesday of this week. Without such an indication of a Fed pause, we may get those much lower lows in stocks sooner that expected.
CHINA AND EMERGING MARKETS
Last week kicked-off with a bang overseas as China’s Xi Jinping is set to begin his third term as China’s supreme leader. Xi, 69, emerged the victor from the ruling Communist Party’s five-year congress, stacking his party’s top tiers with longtime proteges and staunch allies.
While this news itself came as no surprise to most, the big economic issue in China remains Xi’s stronghold on the Chinese people and it’s economy via his continuing zero-Covid policy. Perhaps there had been some hope of a softer tone coming out of the congress, but indeed that was not the case.
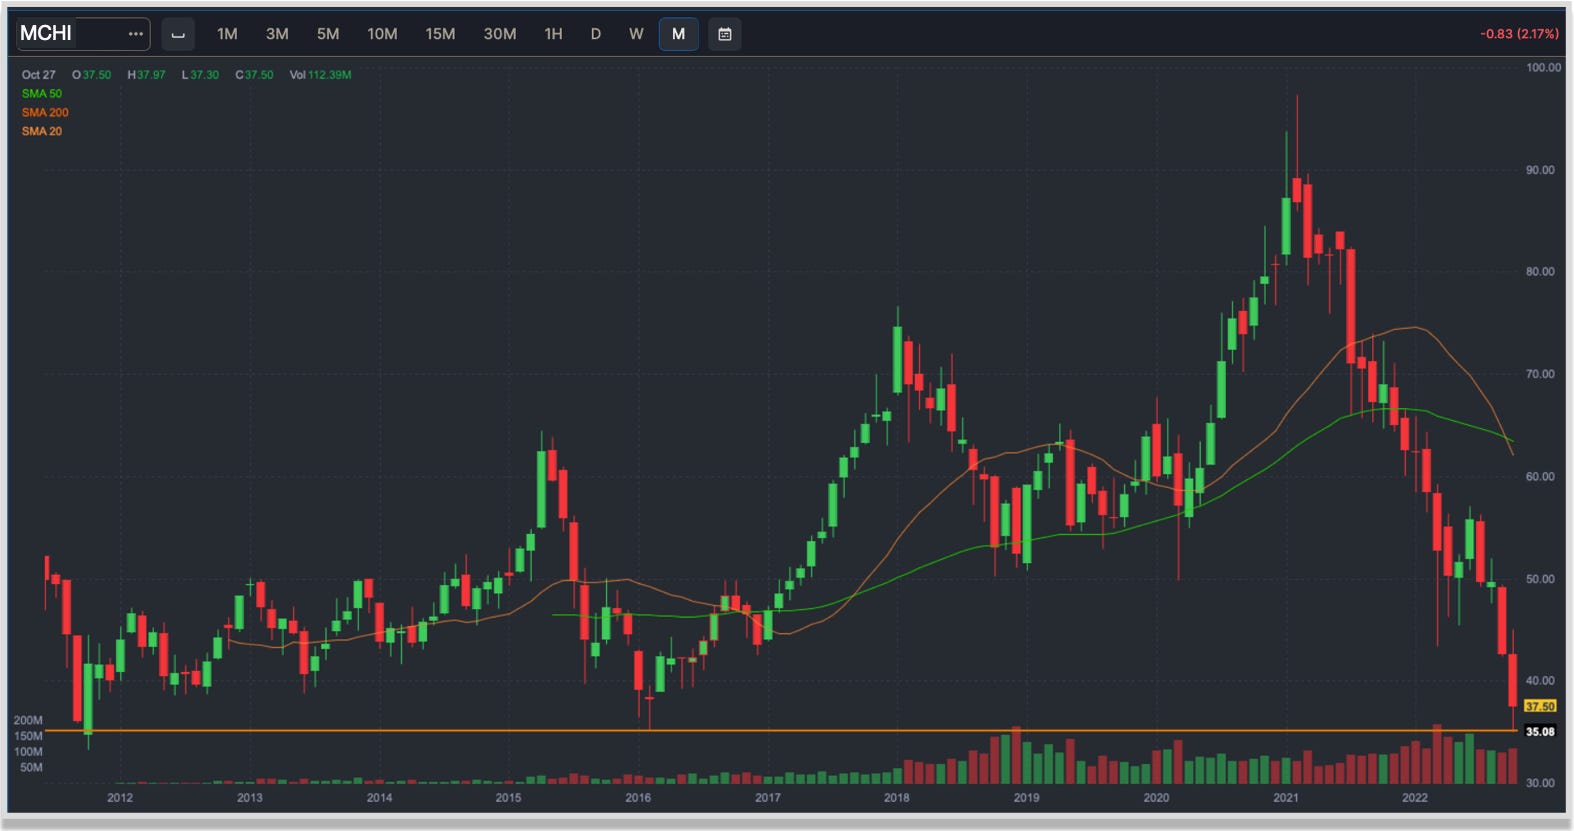
As the Hang Seng index crashed into Monday morning (see chart below), we added to our positions in Chinese stocks and to shares in other emerging market companies.
As you know, the US dollar is the world’s reserve currency and our government has the ability to issue as much of that currency as they like, whenever they like, and in whatever manner they see fit. The key here is that as all commodities and international exchange of goods settle in US dollars.
That means that when the dollar is experiencing relative strength versus other currencies as it has been over the past couple years, the price of goods in other countries can increase dramatically which can have a deleterious effect on the economies of those countries. Most susceptible are many of the emerging market economies.
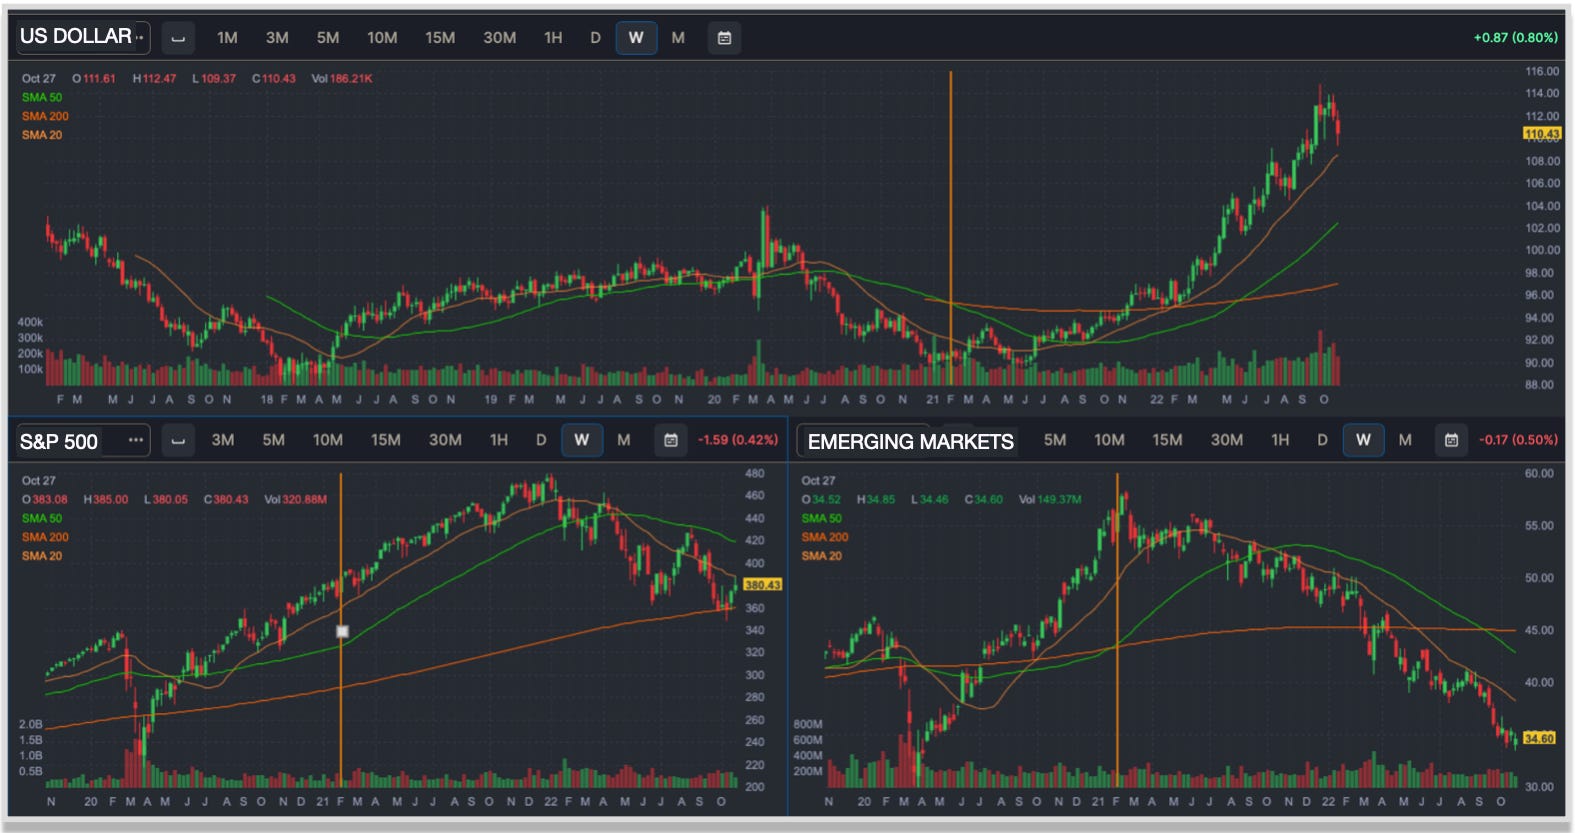
This is best illustrated in the chart s below. In each chart, the orange vertical lines are drawn at Feb 2021. This is the point where the dollar began to significantly strengthen (top chart) while emerging markets simultaneously began to underperform the S&P 500 (lower charts).
At some point, this dynamic will turn in favor of emerging markets as the dollar finally begins to weaken. It may take many more months for this to begin to occur, but this is a great time to begin looking for opportunities to build positions in emerging market stocks.
It is interesting to note here that particularly since the Covid lockdowns began and US government started handing out trillions of dollars everyone assumed the US dollar would collapse. Ironically though, the opposite has occurred over the past 18 months
At this time, there is nothing more important in the world of macro investing than the US dollar and the impact it’s having on markets and assets the world over. We highly recommend that you check out Brent Johnson’s Dollar Milkshake Theory. Published “way back” in 2018, his theories are playing out right in front of us today, and it’s important to understand the potential implications as we move forward.
FEDERAL RESERVE, INTEREST RATES & US TREASURIES
On Tuesday we saw housing market data come in extremely weak and stocks rallied sharply on this and other poor economic news as hopes that a more dovish Fed would help push stocks higher.
The Fed will set a new target for the overnight lending rate on Wednesday of this week — and more importantly will provide guidance on how their monetary policy may proceed over the coming months. On Tuesday last week, the Fed leaked to the Wall Street Journal that we’ll see one more rate hike next Wednesday and the Fed will then pause.
At this point we are expecting a 75bps (0.75%) rate hike moving the Fed target rate to 4.00% and we do expect the Fed to pause — at least that is what the US equity market is telling us at this time.
However, as noted earlier there is a significant lag between rate hike announcements and their effect on economy, and we believe the Fed has already pushed too far.
Below is a chart of the 20+ year US treasury fund (TLT), the price of which is inverse to it’s yield. So the sharp drop in TLT this year is an illustration the meteoric rise in interest rates. We continue to slowly add to our TLT position as we believe this may be a favored asset down the road as the economy slows.

OUR PERFORMANCE YTD
As of October 30, 2022 our portfolio is -2.2% YTD compared with the S&P 500 -18.7%, the Nasdaq composite -29.9% and the Russell 2000 -18.7% for the same period.
PLEASE NOTE WE ARE NOT SUGGESTING YOU TRY TO MIMIC OUR PORTFOLIO AND WE ALSO DO NOT EXPECT OUR READERS’ PORTFOLIO PERFORMANCE TO MATCH OURS IN ANY WAY.
WE PROVIDE OUR PORTFOLIO ONLY TO ADD CONTEXT TO THIS POST. PLEASE DO NOT BUY OR SELL ANY INVESTMENT PRODUCTS BASED ON THIS PUBLICATION!
IN CLOSING
If you have any questions or if you want to continue the discussion about this post please Comment or join our free Chat, and visit our “About” section to learn more about FiNiche.

DISCLAIMER
FiNiche and it’s team members are not licensed investment advisors. Nothing produced or discussed under the FiNiche brand should be construed as personal investment advice. We do not benefit from, nor do we make solicitations related to, the buying or selling of securities or any other investment products. Information provided by FiNiche is intended for general informational, educational and entertainment purposes only. Please do your own research and be sure you have a solid plan before putting a dime of your money into these crazy markets.