


From India to Indonesia
From India to Indonesia
A look at our favorite emerging markets, and a peak at FiNiche’s new offerings coming in 2023

With so much apocalyptic talk out there we want to continue to bring you our thoughts on opportunities to slowly begin building positions for the long term. While we remain completely prepared for a coming global economic slowdown, we know there may be vast opportunities to make money on the other side of that; particularly for those who will have properly protected their assets through to the conclusion of the current bear market.
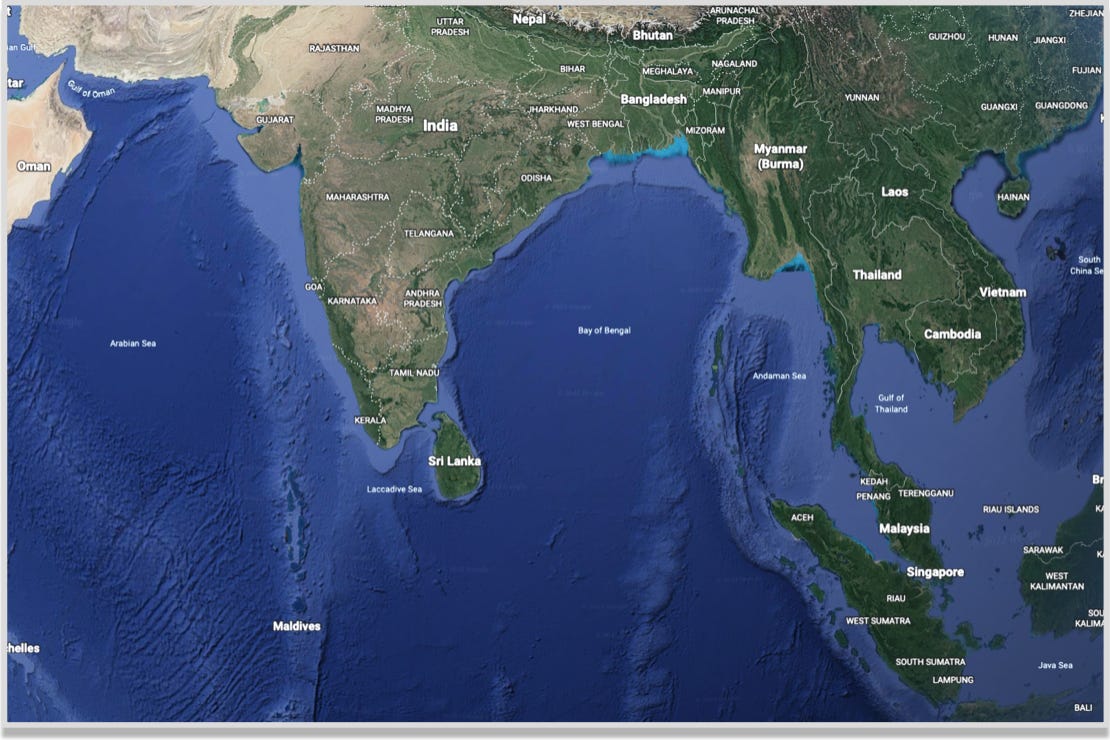
Our primary focus in this article are the rapidly-growing economies of India and the nearby countries who may also benefit from this growth. The subject region is roughly illustrated below, surrounding the Bay of Bengal from India to Indonesia as our title suggests.
INDIA: THE WORLD’S FASTEST GROWING ECONOMY
India is the fastest growing major economy in the world and currently ranks 5th in terms of size behind only USA, China, Japan and Germany (India is practically tied with UK).
India, ranked only #143 in terms of GDP has tremendous room for growth as the country currently has only one-sixth the output per capita compared to China. China itself is still far from a wealthy country though it has lifted hundreds of millions out of poverty — India appears on a path to do the same.
India’s free market economy really got started around the same time as China’s in the early 1990’s after the collapse of the Soviet Union which was India’s primary trading partner at that time.
Before 1990 India’s economy was a hybrid of a free market system left over from British colonialism and a Soviet-style centrally-planned economy. Businesses were burdened by onerous regulations for licensing which went beyond business competency and safety, and made it difficult for legitimate enterprises to get off the ground. As a result, most big businesses had no interest in considering India as a center of operations.
Following the collapse of the Soviet Union in Dec 1991, and resulting partly from overall poor economic performance in the region, India faced a large international debt problem and barely avoided going bankrupt with a last-minute loan from the International Monetary Fund (IMF).
But since 1991 and particularly since 2000, India has been on a strong growth trajectory, effectively doubling in size every five years.

Over the past several years there have been tens-of-thousands of manufacturing jobs that might have gone to China, but instead went to India. Perhaps India is to become the next workshop of the world — or perhaps something much greater is in store.
Check out the Oct 6, 2022 episode of the “Economics Explained” podcast to hear more about this.
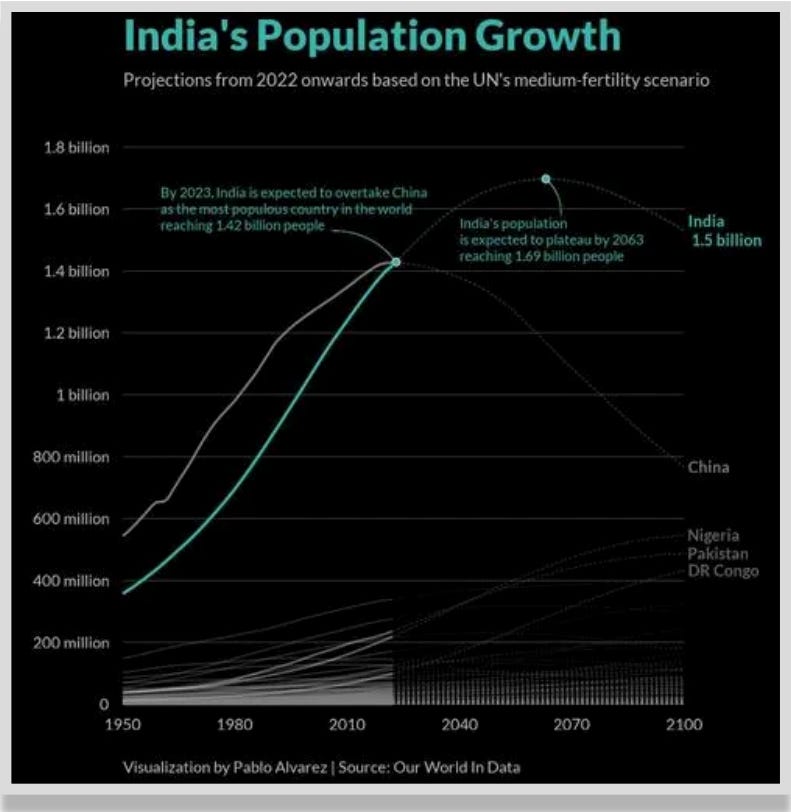
INDIAN POPULATION TO SURPASS CHINA IN 2023
With more than 1.4 billion people, India is home to roughly 18% of the world’s population and is expected to be the world’s most populous country within a matter of months, finally surpassing China.
In the 1800s, China’s population was about 322 million, which was nearly double India’s at the time — and until the mid-20th century both countries’ populations stayed relatively stable.
However, in 1949, China’s population started to experience dramatic growth. This occurred after the Chinese Civil War when the People’s Republic of China was first established. Around the same time, India’s population had also started to increase. Since both countries were experiencing population booms, the status quo remained and China kept its position as the world’s most populated country.
China’s baby boom lasted two decades. But by the late 1970s, the Chinese government implemented a one-child policy in an attempt to slow things down and control population growth, out of fear that China was becoming overpopulated. The plan worked—according to China’s National Health and Family Planning Commission spokesman Mao Qunan, the government’s efforts ended up reducing the number of births over the years by roughly 400 million.
These days, China has one of the most rapidly aging populations in the world. By 2040, it’s expected that 28% of the country’s population will be over the age of 60. In contrast, India’s population is relatively young — half of its population is under 30, and only an eighth is over 60.
As opposed to most of the countries ahead of it whose aging populations’ skills are generally misaligned for today’s world, India still has a young and productive workforce with favorable demographics that include a median age of 28 yrs. India is also the second largest English-speaking nation in the world with more than 125 million English speakers.
INDIA’S LARGEST COMPANIES
While the entire Indian stock market is quite small at around $2.7 trillion (about the same size as Apple stock currently), some of the country’s largest companies are traded on the New York Stock Exchange. Here are a few examples:
Tata Motors
Tata Motors headquartered in Mumbai designs, builds and sells automotive vehicles under the brands Tata, Daewoo, Harrier, Safari, Fiat, Nexon, Altroz, Punch, Tiago, Tigor, Jaguar, and Land Rover. Market Cap $19 billion. Source: Yahoo Finance
HDFC Bank
HDFC Bank, based in Mumbai, provides banking and financial services to individuals and businesses in India, Bahrain, Hong Kong, and Dubai. Market Cap $103 billion. Source: Yahoo Finance
ICICI Bank
ICICI Bank, based in Mumbai, provides various banking products and services in India and internationally. Its operations include retail banking, wholesale banking, treasury and insurance, among others. Market Cap $79 billion. Source: Yahoo Finance
Infosys Limited
Infosys Limited, headquartered in Bengaluru, together with its subsidiaries provides consulting, technology, outsourcing, and next-generation digital services in primarily North America, Europe, and India. Market Cap $77 billion. Source: Yahoo Finance
Dr. Reddy’s Laboratories
Dr. Reddy's Laboratories, together with its subsidiaries, operates as an integrated pharmaceutical company worldwide. Dr. Reddy's Laboratories Limited was incorporated in 1984 and is headquartered in Hyderabad, India. Market Cap $9 billion. Source: Yahoo Finance
WNS Holdings
WNS Holdings Limited, a business process management company, provides data, voice, analytical, and business transformation services worldwide. WNS (Holdings) Limited was founded in 1996 and is based in Mumbai, India. Market Cap $4 billion. Source: Yahoo Finance
PLEASE DO NOT TRANSACT IN ANY OF THE SECURITIES DISCUSSED IN THIS POST JUST BECAUSE WE MENTION THEM HERE. ANY SECURITY OR INVESTMENT PRODUCT LISTED HERE IS PROVIDED FOR CONTEXT ONLY. THIS POST IS NOT TO BE CONSTRUED AS INVESTMENT ADVICE.
INDIA’S TOP EXPORTS
INDIA: Population 1.4 billion, Median age 28, 2021 GDP $3.2 trillion (GDP per capita: 2285)
The following export product groups categorize the highest dollar value in Indian global shipments during 2021.
Top Exports
Mineral fuels including oil: US$56.4 billion (14.3% of total exports)
Gems, precious metals: $38.2 billion (9.7%)
Machinery including computers: $24.2 billion (6.1%)
Iron, steel: $21.2 billion (5.4%)
Organic chemicals: $21.2 billion (5.4%)
Pharmaceuticals: $19.5 billion (4.9%)
Vehicles: $18.9 billion (4.8%)
Electrical machinery, equipment: $18.8 billion (4.8%)
Cereals: $12.4 billion (3.1%)
Cotton: $10 billion (2.5%)
India’s top 10 exports accounted for 61% of the overall value of its global shipments.
Source: worldstopexports.com
A final note on India: if you’re not yet convinced of the importance of India in terms of world trade and geopolitical issues, read this news post from Nov 13, 2022 that discusses the latest in relations between the US, India and Russia.
OTHER EMERGING MARKETS IN THE REGION
India receives about 60% of its imports from countries within Asia. Referring back to the area illustrated in the map above, below are some of the other “emerging market” countries where we are looking for opportunities to invest.
One thing that strikes us about the numbers below is the relatively low GDP per capita and median age in this group of countries — much like India — as compared with the more developed regions of the world. In terms of economic demographics, this combination may be quite favorable in terms of future economic growth for the entire region.
INDONESIA
Population 280 million, median age 31, 2021 GDP $1.2 trillion (GDP per capita: 4,285)
Top Exports
Mineral fuels including oil: US$45.1 billion (19.8% of total exports)
Animal/vegetable fats, oils, waxes: $32.8 billion (14.4%)
Iron, steel: $20.9 billion (9.2%)
Vehicles: $8.6 billion (3.8%)
Electrical machinery, equipment: $8.5 billion (3.7%)
Rubber, rubber articles: $7.1 billion (3.1%)
Other chemical goods: $6.9 billion (3%)
Ores, slag, ash: $6.4 billion (2.8%)
Machinery including computers: $6.3 billion (2.8%)
Footwear: $6.2 billion (2.7%)
By value, Indonesia’s top 10 exports totaled 65% of it’s total exports.
TAIWAN
Population 24 million, median age 42 , 2021 GDP $774 billion (GDP per capita: 32,250)
Top Exports
Electrical machinery, equipment: US$219.3 billion (49% of total exports)
Machinery including computers: $57.6 billion (12.9%)
Plastics, plastic articles: $26.5 billion (5.9%)
Optical, technical, medical apparatus: $19.9 billion (4.4%)
Vehicles: $13.6 billion (3%)
Iron, steel: $12.8 billion (2.9%)
Organic chemicals: $11.8 billion (2.6%)
Mineral fuels including oil: $10.3 billion (2.3%)
Articles of iron or steel: $9.3 billion (2.1%)
Copper: $5.4 billion (1.2%)
Taiwan’s top 10 exports accounted for 86% of the overall value of its global shipments.
THAILAND
Population 70 million, median age 39, 2021 GDP $506 billion (GDP per capita: 7,228)
Top Exports
Machinery including computers: US$44.7 billion (16.8% of total exports)
Electrical machinery, equipment: $40 billion (15%)
Vehicles: $31.7 billion (11.9%)
Rubber, rubber articles: $19.7 billion (7.4%)
Plastics, plastic articles: $15.5 billion (5.8%)
Gems, precious metals: $9.9 billion (3.7%)
Mineral fuels including oil: $9.6 billion (3.6%)
Fruits, nuts: $6.2 billion (2.3%)
Meat/seafood preparations: $6 billion (2.2%)
Organic chemicals: $5.6 billion (2.1%)
Thailand’s top 10 exports accounted for 71% of the overall value of global shipments.
SINGAPORE
Population 5.9 million, median age 42, 2021 GDP $397 billion (GDP per capita: 67,288)
Top Exports
Electrical machinery, equipment: US$167.1 billion (36.5% of total exports)
Machinery including computers: $69.2 billion (15.1%)
Mineral fuels including oil: $46 billion (10%)
Optical, technical, medical apparatus: $22.3 billion (4.9%)
Gems, precious metals: $21.1 billion (4.6%)
Plastics, plastic articles: $15.9 billion (3.5%)
Organic chemicals: $13.8 billion (3%)
Perfumes, cosmetics: $10.4 billion (2.3%)
Pharmaceuticals: $10.3 billion (2.2%)
Other chemical goods: $7.2 billion (1.6%)
Singapore’s top 10 exports represent 84% of the overall value of its global shipments.
MALAYSIA
Population 33 million, median age 29, 2021 GDP $373 billion (GDP per capita: 11,303)
Top Exports
Electrical machinery, equipment: US$102.8 billion (34.4% of total exports)
Mineral fuels including oil: $37.2 billion (12.4%)
Machinery including computers: $25 billion (8.4%)
Animal/vegetable fats, oils, waxes: $19.6 billion (6.6%)
Rubber, rubber articles: $16.8 billion (5.6%)
Optical, technical, medical apparatus: $12.6 billion (4.2%)
Plastics, plastic articles: $10.3 billion (3.4%)
Aluminum: $7.3 billion (2.4%)
Iron, steel: $6.6 billion (2.2%)
Other chemical goods: $6 billion (2%)
Malaysia’s top 10 exports accounted for 82% of the overall value of its global shipments.
VIETNAM
Population 96 million, median age 32, 2021 GDP $362 billion (GDP per capita: 3,770)
Top Exports
Electrical machinery, equipment: US$172.8 billion (42.5% of total exports)
Machinery including computers: $33.4 billion (8.2%)
Footwear: $25.2 billion (6.2%)
Furniture, bedding, lighting, signs, prefabricated buildings: $19.1 billion (4.7%)
Knit or crochet clothing, accessories: $17.8 billion (4.4%)
Clothing, accessories (not knit or crochet): $15.8 billion (3.9%)
Iron, steel: $10.1 billion (2.5%)
Plastics, plastic articles: $7.8 billion (1.9%)
Optical, technical, medical apparatus: $6.21 billion (1.5%)
Rubber, rubber articles: $6.16 billion (1.5%)
Vietnam’s top 10 exports accounted for 77% of the overall value of its global shipments.
Sources of data above: World's Top Exports, Worldometer, Google
US DOLLAR RELATIONSHIP
As the dollar is the world’s reserve currency, all commodities and international exchange of goods settle in US dollars.
That means that when the dollar is experiencing relative strength versus other currencies as it has been over the past couple years, the price of goods in other countries can increase dramatically which can have a deleterious effect on the economies of those countries. Most susceptible are many of the emerging market economies.
This is best illustrated in the charts below. In each chart, the orange vertical lines are drawn at Feb 2021. This is the point where the dollar began to significantly strengthen (top chart) while emerging markets simultaneously began to underperform the S&P 500 (lower charts).
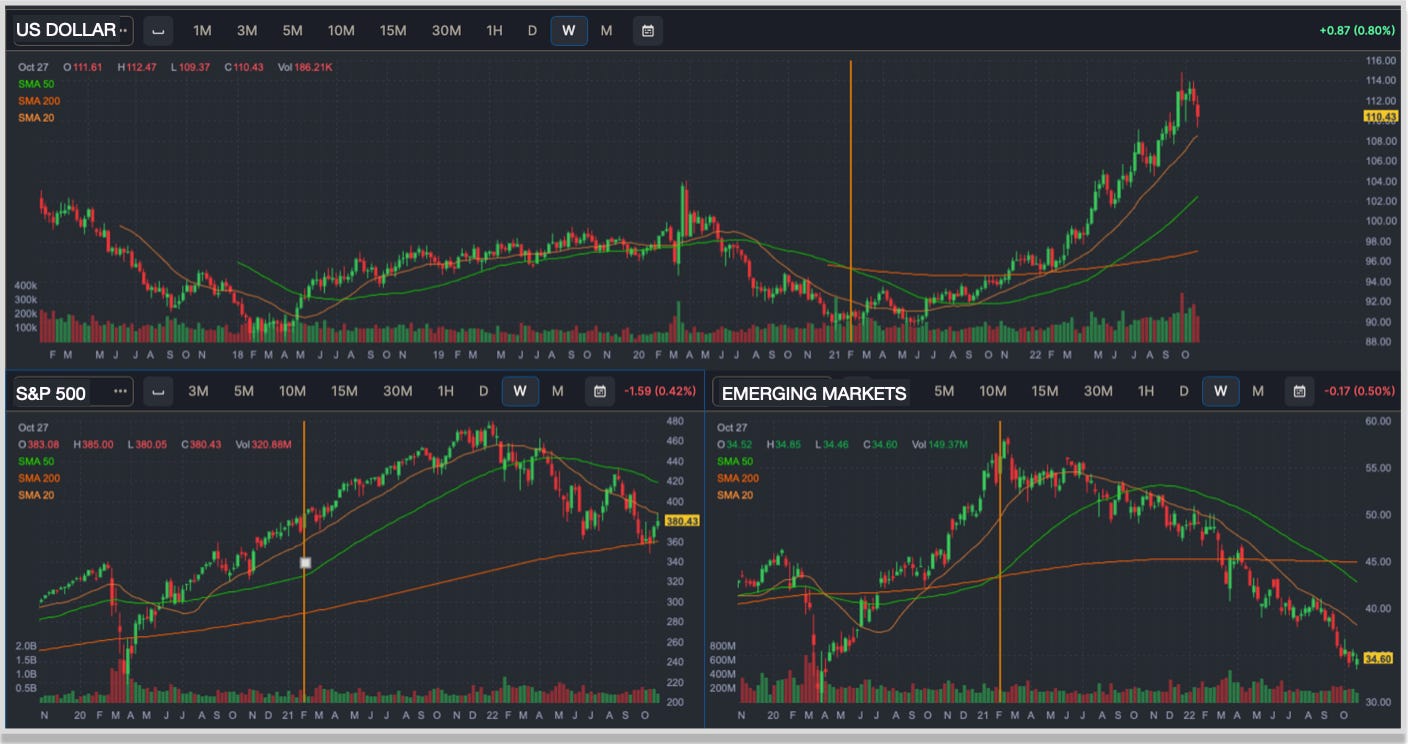
At some point - and to be sure it may well be a long while - this dynamic may turn in favor of emerging markets as the dollar finally begins to weaken. Though things may get much worse before they get better, this may be a great time to begin looking for opportunities to build positions in emerging market shares.
PLEASE DO NOT TRANSACT IN ANY OF THE SECURITIES DISCUSSED IN THIS POST JUST BECAUSE WE MENTION THEM HERE. ANY SECURITY OR INVESTMENT PRODUCT LISTED HERE IS PROVIDED FOR CONTEXT ONLY. THIS POST IS NOT TO BE CONSTRUED AS INVESTMENT ADVICE.
It is interesting to note here that particularly since the Covid lockdowns began and US government started handing out trillions of dollars, everyone assumed the US dollar would collapse. Ironically though, the opposite has occurred over the past 18 months.
At present time, there remains a strong inverse correlation between US dollar strength and risk asset prices the world over. If you would like to understand more about this dynamic, we recommend you check out Brent Johnson’s Dollar Milkshake Theory. Published “way back” in 2018, his theories are playing out right in front of us today, and it’s important to understand the potential implications as we move forward.
NEW FiNiche OFFERINGS COMING IN EARLY 2023
Over the past several months we have received a lot of great feedback from our audience and to better serve our readers we’re working on a new menu of offerings to help our readers gain access to the content-level of their preference.
Beginning in Q1.23 (still working on exact date), this Free Newsletter will incorporate a new level of Paid detail and we will have 3 tiers of Subscriber for our readers to choose from. Our current plan looks something like this:
FREE SUBSCRIBERS
Continue receiving the free version of our monthly FiNiche Newsletter
Continue receiving our occasional Flash Market Update
Continue to Chat with us via the Substack app
PAID SUBSCRIBERS (likely less than ten dollars a month, with discount for annual subscription)
Receive all free subscriber content, plus…
Receive the full version of our Newsletter that will include a look at our current portfolio holdings, significant trades of the past month and what we’re currently watching in terms of our investments
We’ll add you to our new weekly ‘Market Minutes’ post that will discuss significant happenings in the global markets along with our view of potential impacts for investors
You’ll be able to Comment and join the community
FINICHE PRO (annual subscription only, still working on price)
Receive all paid subscriber benefits, plus…
We’ll meet with you One-on-One via a quarterly ‘Zoom’ call to discuss your individual circumstances and help you learn how to best incorporate our knowledge into your own portfolio management methodology
You’ll have access to a dedicated email address to connect directly with our team
We expect to be able to share more details in the next edition of this Newsletter.
Whether you choose a free or paid subscription, we want to reiterate that NEITHER FINICHE NOR ANY OF ITS TEAM IS A REGISTERED INVESTMENT ADVISOR. For your own safety, please do not transact in any security discussed under the FiNiche brand just because we mention it. Any security or investment mentioned under the FiNiche brand is provided for context only. Nothing published under the FiNiche brand its to be construed as investment advice. Each investor’s set of circumstances is unique. Please do your own research and/or speak to a professional before putting a dime of your money into these crazy markets.
IN CLOSING
If you have any questions or if you want to continue the discussion about this post please Comment or join our free Chat, and visit our “About” section to learn more about FiNiche including how to contact us directly.

Disclaimer
FiNiche and it’s team members are not licensed investment advisors. Nothing produced or discussed under the FiNiche brand should be construed as personal investment advice. We do not benefit from, nor do we make solicitations related to, the buying or selling of securities or any other investment products. Information provided by FiNiche is intended for general informational, educational and entertainment purposes only. Please do your own research and be sure you have a solid plan before putting a dime of your money into these crazy markets.