


The Big Portfolio Refresh 2022.12
Detailed portfolio holdings & current macro view

In this issue
Macro Framework
Economic Indicators
Monetary Policy
The ‘60/40’ portfolio
Short-Term Technicals
The FiNiche Portfolio
Portfolio Composition
Holdings Detail
Performance
Portfolio Alternatives
MACRO FRAMEWORK
We continue to believe we are in the beginning stages of a secular bear market that may last for years. In our opinion, you’d have to go back to the period 1966-1982 to find the most recent example of this type of market. There was also a similar period of lackluster growth from 1996-2009 during which time the economy saw two separate boom-bust cycles with the S&P 500 ending relatively flat overall.
Following the tremendous appreciation of stock prices during the most recent bull market of 2009-2021, we want to remind our readers that stocks do not always ‘go up’ and that buy-and-hold investing may continue to disappoint for quite some time.
To be clear, we are not ruling out the possibility of new all-time highs for stocks while we wait for lower lows. Always with an open mind we take things one day at a time, keep a close eye on the charts, and try to remain in a position to act as needed to reduce our risk exposure while being ready to take advantage of upside moves.
At present time, surprising as it may be, the Dow Jones Average is near its all time high while the majority of stocks continue to trade much closer to their Sep/Oct lows. Significant outperformance of the Dow, a 30-stock index, is generally not a sign of good things to come for risk assets.
The bottom line for us is we remain very active with our portfolio allocation as we expect increased volatility in both directions to continue for the foreseeable future.
LEADING ECONOMIC INDICATORS & RECESSION
While the labor market, real consumer spending and earnings have materially slowed down in the last few months, the US economy is not yet in a recession according to NBER which uses many points of data to determine recession, including unemployment which is still quite low — a statistic that will almost certainly deteriorate as we move into 2023.
As reported by
last week, the US Conference Board’s leading indicator index, which incorporates the top statistically significant forward-leading indicators for the US economy, has an impressive track record for anticipating recessions. Over the last 50+ years, every time the YoY series of this index prints in negative territory for 2+ consecutive months a recession is guaranteed.That trigger was hit in August 2022, and the median lead time is 7 months.

From The Macro Compass: “As this indicator keeps dropping, it’s hard to estimate the magnitude of the recession yet - it first needs to bottom, and then we will be able to quantify that. For the time being: recession to start in March 2023, according to this forward-looking indicator.”
So there you have it. And for now this is our base case.
MONETARY POLICY
The primary focus of the FOMC (the Fed) this year has been fighting the inflation that began strengthening partly as a result of supply shortages created by the covid lockdown, post-lockdown fiscal stimulus and a continuation of the zero-covid policy in China, to name a few of the culprits.
The Fed’s target interest rate has already been increased to 4%, up from 0.25% a year ago. This unprecedented move toward tighter monetary policy, along with already-lackluster economic data, has likely already ensured the arrival of a recession beginning in 2023 as noted above.
Recessions are a normal and healthy part of the business cycle, and generally they are nothing to fret over. However, over the course of the past several decades, as monetary and fiscal tools have been increasingly used to uplift the economy and the stock markets, the amount of stimulus needed to produce a similar result continues to increase exponentially with each boom-bust cycle.
We believe the Fed will continue to push rates a bit higher before they pause, and by sometime in late 2023 they may well find themselves targeting lower rates again — but certainly not until stock prices find much lower lows.
In case you hadn’t noticed, the FOMC wants stock prices much lower in order to help slow inflation. They’ve been very clear about that all year and we continue to follow their lead.
THE ‘60/40’ PORTFOLIO
During periods of persistent inflation, such as 2022 as well as the period 1966-1982 (referenced above), there is typically a strong correlation between stock prices and bond prices, making the standard 60/40 portfolio impractical and ineffective. We believe the standard 60/40 portfolio will continue to underperform and frustrate investors as inflation is likely to remain persistent for the foreseeable future.
In previous posts we discussed at length both the overall construction of our portfolio as well as the ‘opportunistic tranche’ in more detail. We encourage you to go back and read those pieces to better understand our approach.
In short, our model portfolio uses a 35% dynamic opportunistic tranche rather than the standard 40% static bond portfolio. That tranche can go from all-cash to all-equities and anywhere in between quite rapidly. In this way we are able to maximize opportunities to both mitigate risk and grow our assets.
The problems with the ‘60/40’ are further complicated when using another long-trusted approach called ‘buy-and hold’. The term is probably self-explanatory, but the idea is that if we are going to continue to have wild swings both up and down in stock prices for the foreseeable future (see secular bear market above), then not only does buy-and-hold generally return poor results for long periods, but the investor also misses out on opportunities to take advantage of those big swings — think “buy low, sell hi”. :-)
SHORT TERM TECHNICALS
As discussed in a previous post: While we feel great about all of our equity positions, it is important to understand that the stock market is structured in such a way that all stocks generally move with some correlation to the S&P 500. As an analogy, think of small boats in the ocean tossed about in the wake of a large cruise ship passing by — the boats ride up and down with some correlation to the big ship. Now imagine the small boats are stocks and the cruise ship is the S&P 500. Due in part to the extreme overuse of passive investing, as the S&P goes so go most stocks in its wake.
With that in mind, below are a couple charts to give you an idea of where we are in the larger stock market cycle.
Illustration 1 is a daily chart of the S&P 500 (SPY). Each of the orange lines shown in the chart represent near-term resistance levels. If the current up-trend continues, we will look to take gains where appropriate and perhaps add to our short positions if the opportunity presents itself. The chart here suggests a potential near-term max upside of about 410-412 on the SPY. As always, we just watch the charts and take it one day at a time.

Ultimately we are looking for stocks to head lower over time. In Illustration 2 we see a few lines of support that may represent logical inflection points for the S&P 500. Note that line A represents a drop of about 15% from the current level, line B about 25% lower, and line C about 45% lower than we are today. All these levels are well within the range of what we would consider a potential pullback and may create vast opportunities to invest down the road.

And with that, let’s dig into our Portfolio!
THE BELOW PORTION OF THIS NEWSLETTER IS STILL BEING OFFERED FREE OF CHARGE TO ALL OUR READERS. PLEASE SEE OUR ABOUT PAGE FOR SUBSCRIPTION TIERS COMING IN FEBRUARY 2023.
THE FINICHE PORTFOLIO
FIRST, A CAUTIONARY NOTE
We know that some of our readers are experienced enough to translate the content of our portfolio illustrations into actionable steps for building and managing their own portfolio tailored to their own needs. However we also know that some of you may lack proper experience and the last thing we want to do is mislead anyone.
The information provided here is:
Intended to put our macro framework into context for the experienced investor
Not to be construed as investment advice for any specific individual investor
Model portfolio allocation
In previous posts we discussed at length both the overall construction of our portfolio as well as the ‘opportunistic tranche’ in more detail. We encourage you to go back and read those pieces to better understand our approach.

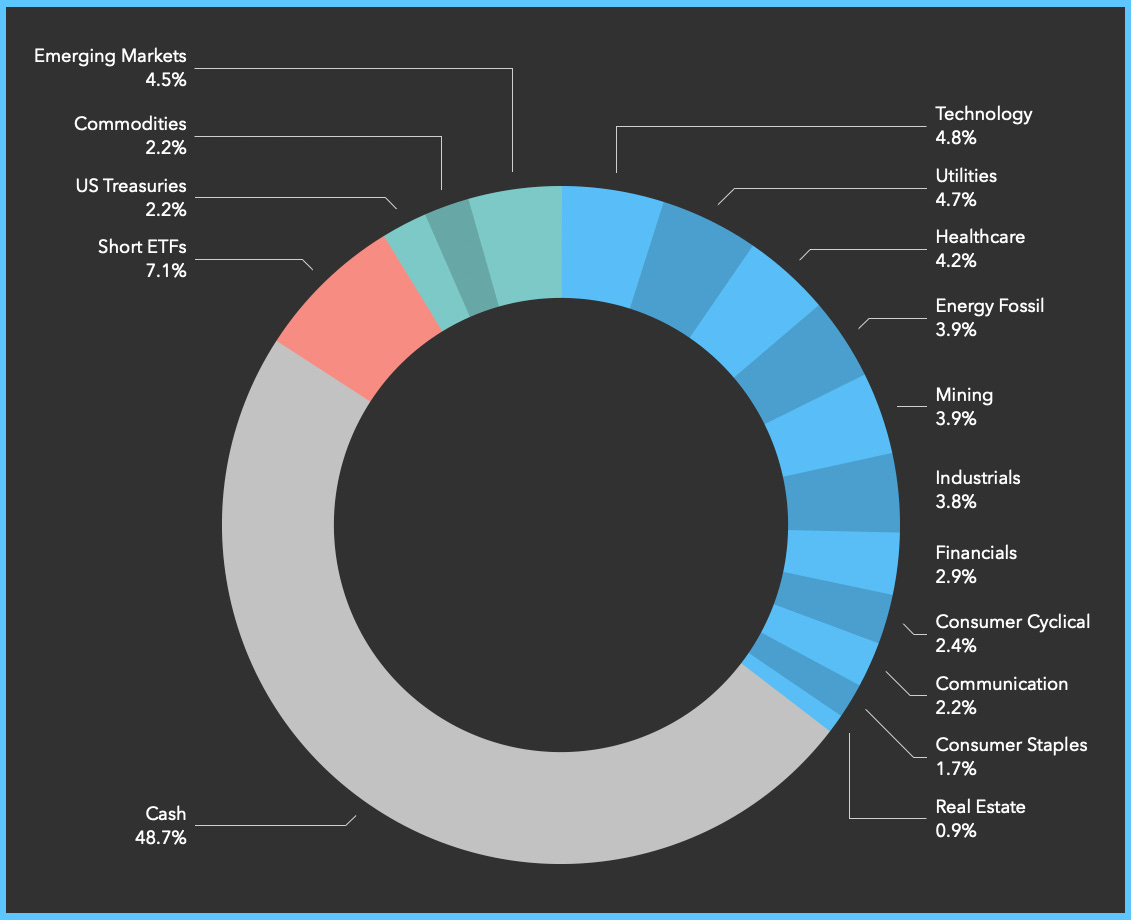
Actual portfolio allocation: current high-level view
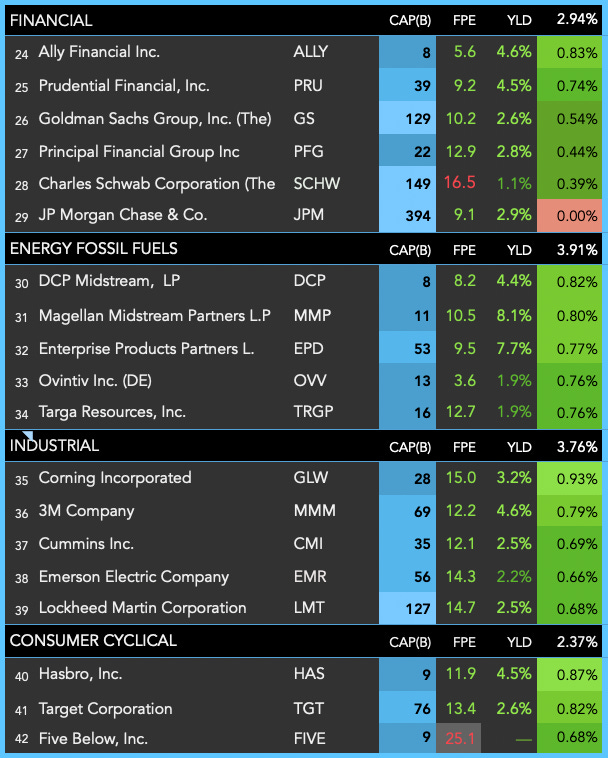
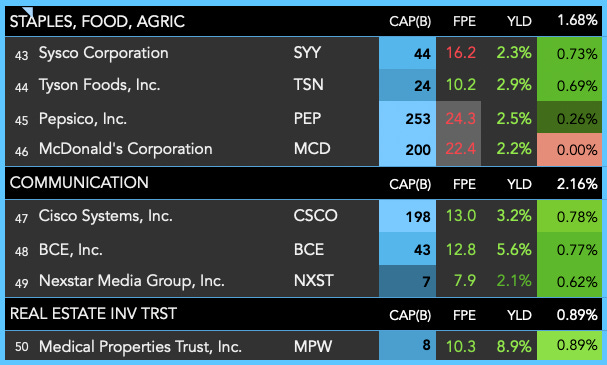
Current holdings
Our current holdings are listed in the tables below. Each position shows the following fields, arranged by sector:
Market Cap in $ billions
Forward P/E
Dividend Yield
Position size as percent of total portfolio
Note: Our portfolio is actively managed. Any position you see here is subject to change at any moment and may not exist in our portfolio by the time you read this. Tables and illustrations below are not to be construed as investment advice. Please do not buy or sell any securities mentioned here without first receiving investment advice from a professional. If we can help in any way, please visit our About page to contact us.


Portfolio composition highlights

Performance
We do not expect our reader’s performance to match ours as our portfolio is very actively managed. The information here is intended to provide context only. Our performance is not an indication of our readers’ expected performance, nor is it an indication of expected performance for those who follow our method.

ETF-only portfolio as alternative
If your preference is to avoid individual stocks and build an all-ETF portfolio, that may work well for you also. There is a big world of ETFs available out there and we know many people who have successfully constructed excellent portfolios using only ETFs.
If you would like help to better understand the ETF landscape please either seek the advice of a professional of your choice and/or visit our About page to contact us for more information.
INTRODUCING OUR NEW SERIES
Many have asked for it, now it’s here!
This is the first edition of our new biweekly “Portfolio Refresh” series.
Many of our readers have been looking for a way to follow along with us as we navigate the markets and we think this series will be helpful in that regard.
For now we are delivering this to all our subscribers free of charge to give you an idea of the content we’ll be providing going forward. Please see our About page for details regarding subscription tiers coming in February.
IN CLOSING
If you have any questions or if you want to continue the discussion about this post please Comment or join our free Chat, and visit our About section to learn more about FiNiche including how to contact us directly.
