


The Big Portfolio Refresh 2023.02
Detailed Holdings, Portfolio Guidance, Macro Update

In this issue:
MACRO UPDATE
Overview
January Effect
China Reopening
Labor Market, Mass Layoffs
Recession Revisited
The Charts
Impacts for Investors
PORTFOLIO DETAIL
Portfolio Objective
Asset Allocation
Current Holdings and Rationale
Composition Highlights
Recent Trades
Performance
ETF-only Portfolio Alternative
FOREWORD
On the first of each month, I publish my Big Portfolio Refresh which focuses on the current details of my investment portfolio, preceded by an update to my outlook for the investment markets.
If you are looking for additional recent market observations, you can reference my latest mid-month Market Minutes post — the next of which is due out Feb 15.
As always, I continually test and revise both my macro views and portfolio holdings in a effort to keep pace with ever-changing market dynamics, ultimately making dozens of decisions each day as I take things one chart at a time.
This article is being published prior to the FOMC rate decision and commentary which will be released today at 2:00 PM EST.
If you choose to listen to this article rather than read it (which I often do), note there are a lot of charts with captions here, so remember to take a look as well.
MACRO UPDATE
OVERVIEW
Stocks are off to a roaring start in 2023, and with the current rally the bearishness in the market has significantly subsided (see chart below under ‘January Effect’). This, combined with the US Dollar index perhaps finding solid support near current levels, may suggest that the cyclical rally in the US stock index may soon end. I have included a dollar index chart below as well.
The bond market now seems to be challenging the federal reserve’s outlook that the federal funds rate for the next year or two will remain relatively high with no rate cuts. The bond market suggests that inflation will fall significantly by late summer 2023, suggesting a high probability of a disinflationary recession.
If you look at the spread between short term and long term rates, say Q3.2023 vs. Q3.2024 this year we see one of the biggest diversions ever on the front end of the yield curve — meaning the expected yield in 2024 is much lower than what is expected in 2023.
In order to regain its credibility, I do not see the Fed cutting interest rates until inflation is back to ~2-3%, but the bond market seems to be indicating that a disinflationary environment is fast approaching with a CPI that may move down to those levels sooner than I had anticipated just a couple months ago. So while I still do not see a Fed rate cut coming any time soon, a lower inflationary environment would, at the very least, allow the central bank to create a more dovish narrative should the markets sell-off in a meaningful way — and yes, I still expect such a sell-off in stocks in the months to come.
Predicting the exact timing or strength of any market move is difficult at best. What is of utmost importance for a portfolio manager is knowing where we are in the market cycle.
My view of the current market cycle is summed up pretty well by Craig Johnson on the Financial Sense podcast of Jan 27. He has a stock market outlook for 2023 that he defines as “a hop, a drop, and a pop”. As Craig describes it, the January move is the beginning of the hop, with a drop coming to retest the October lows, followed by a strong stock rally into year end.
Again, the exact timing and strength of market moves is speculative, but Craig’s overview of the cycle is a rough match with my view.
My base case continues to be that US stock indexes will see at least a retrace to recent lows (and perhaps lower lows) before the current bear market is over. However at some point in the year, on the back of what will eventually be a slightly more dovish Fed (maybe not lower rates, but a less-hawkish tone at least) and a potential washout of bullish sentiment, both stocks and commodities may begin a very strong multi-month cyclical bull market rally.
I still believe we are in the beginning of a multi-year secular bear market which will be characterized by extreme volatility in both directions, presenting many opportunities for the active investor while frustrating the buy-and-hold crowd.
My approach within my portfolio is to seek a diversified set of stocks with stable income, strong balance sheet, good competitive position, and consistent dividend payout. In addition, I use my opportunistic tranche to provide a layer of risk management and seek alpha as appropriate.
The current push-pull market dynamics I’m watching include tailwinds from the January Effect and China’s reopening vs. headwinds from mass corporate layoffs and reduced market liquidity.
Let’s review.
JANUARY EFFECT: and renewed bullish sentiment
I won’t spend a lot of time of this topic today since I detailed the theory of the January Effect in previous posts including “Off to the Races”, but WOW what a January it was for the SP.500 which is +5.85% for the year as of Jan 31 pre-market. Most global stock indexes were up nicely in January as well. This has significantly reduced the amount of bearishness for stocks as indicated in the chart below, and we now monitor the extent to which the current rally will climb.

CHINA RE-OPENING: a boost for economic activity
We had already seen a build-up of momentum in the Chinese economy in 2022 as their central bank was providing stimulus, but with a covid lockdown in place, that stimulus was not able to make it into the general economy. Now that the second-largest economy in the world is reopening that built-up potential momentum is being unleashed into the global economy just at at time when it’s needed.
Based on what I am seeing China is bound for a substantial economic rebound during the first half of 2023, and this should have a positive push on the global macro economic picture.
On the flip side however, a sudden rush of Chinese activity is bound to put pressure on global supplies of goods, adding to the inflationary pressures around the globe. Business leaders and policy makers at the World Economic Forum in January noted anxiety over this potential inflationary impact.
DAVOS, Jan 20 (Reuters)
China's reopening after debilitating pandemic restrictions is likely to add to global inflationary pressures as the world's second-largest economy ramps up commodity consumption, European Central Bank (ECB) President Christine Lagarde said on Friday.
"There will be constraints, there will be more inflationary pressure coming out of that added demand in commodities and energy in particular," Lagarde told a World Economic Forum panel
Reading between the lines here: I think we all know that the collection of world leaders in Davos represents the elite class, and the desires of the establishment to preserve the status quo. What, then, can we glean from the statement above? For me, this is a further ‘pounding of the table’ to reassert confidence in the monetary system by doing whatever is necessary to bring down inflation across developed nations. As I have believe since late 2021, it continues to be clear that stock prices will be the collateral damage of the Davos class’ need to reclaim what credibility they can.
Once inflation comes down closer to 2-3%, and if the markets start screaming for help, central banks the world over will go right back to their old ways of devaluing fiat currencies to prop up financial markets. I expect to see that sort of scenario play out over the next year or so.
LABOR MARKET, MASS LAYOFFS: a drag on economic activity
Juxtaposed to the positive news out of China, both Microsoft and Alphabet (parent of Google) announced big layoffs in January, with Google to cut 12,000 jobs and Microsoft 10,000 jobs.
This adds to a very long list of tech company layoffs announced over the past several months including Meta cutting 11,000 jobs, Twitter 3700, Lyft 700, Stripe 1100, Coinbase 1100, Shopify 1000, Netflix 450, Snap 1000, Robinhood 31% of its staff and Tesla 10% of its staff.
According to Layoffs.fyi, 2022 saw 1032 tech companies announce layoffs of 155,126 employees, with 2023 off to an equally depressing start with 210 tech companies already announcing 67,268 additional layoffs.
In the chart below, we can see these numbers are similar to, though far more sustained than, layoffs during the covid lockdown.

With unemployment a lagging or concurrent economic indicator, and with so many job losses not yet realized, we have yet another mark in the ‘recession likely’ column as 2023 unfolds.
RECESSION REVISITED
Market and economic reactions continue to be a reflection of monetary policy with an appropriate lag, and I expect 2023 to be a reflection of the global monetary tightening that took place in 2022.
For the past couple months, I have been forecasting a mild recession to begin mid-2023, and I am still generally onboard with that call. I do want to clarify that I do not make trades based on recession calls, per se. However, I do analyze the variable inputs and elements of a recession to help create a forecast of significant market events that may lie ahead.
The actual calculation of a recession call is highly complex with multiple variables including corporate earnings, the labor market, inflation, global economic activity and GDP.
As an example of the complexity, here’s a quick refresher on GDP.
GDP = C + G + I + NX
C = consumption or all private consumer spending within a country’s economy, including durable goods (items with a lifespan greater than three years), non-durable goods (food & clothing), and services.
G = total government expenditures, including salaries of government employees, road construction/repair, public schools, and military expenditure.
I = sum of a country’s investments spent on capital equipment, inventories, and housing.
NX = net exports or a country’s total exports less total imports
The above comes as a shock to most who see this for the first time as the impact of government spending on GDP is enormous, whether that spending is economically productive or not. Also, with inflation running high, the dollar amount of consumption may grow, but that is not exactly a positive for the economy.
The US has not been in a true recession for about 15 years, with the exception of a minor blip in economic activity in the spring of 2020 which was quickly arrested by massive global stimulus packages. And while many households certainly felt a recessionary impact in their own lives at that time, the recession was barely visible on a macro scale.
Today, with massive corporate layoffs in the works, a global economic slowdown upon us, and corporate earnings being revised downward, it is hard to argue that a recession is not on the horizon.
THE CHARTS
S&P 500
In the first chart here, we see that the rally since the start of the year is now hitting significant resistance.
While in the longer term we see in the chart below support levels should the index pull back.

US TREASURIES
We can visualize the bond market’s expectation for lower rates in the chart below. The sustained rally in bond yields for much of 2022 has led to an opportunity to continue building a position in US Treasuries. I’ll look to add to my TLT position opportunistically.

US DOLLAR INDEX
The US dollar index has fallen since the stock market bottomed in October. With the potential for the dollar to find support at current levels, the stock market rally may soon take a break.

EMERGING MARKETS
Some of the positive China reopening effects are spilling over into emerging markets in Southeast Asia. I also continue to like Mexico and Brazil in the western hemisphere for the long term as I see a slow but sure move toward a regionalization of the broader global economies.
The chart below is a bit busy to see all the details, but these weekly charts that span ~7 years provide a sense of price volatility diversification among with the geographic diversification represented by the countries herein.

WTI CRUDE OIL & MIDSTREAM ENERGY COMPANIES
After reaching a high of $130/bbl in early March following the start of the Russia-Ukraine conflict, oil has pulled back near its long-term mean making it more practical to add to positions in this sector. While a recession could certainly push oil below $60, I expect the midstream companies in my portfolio to remain relatively stable for the longer term.
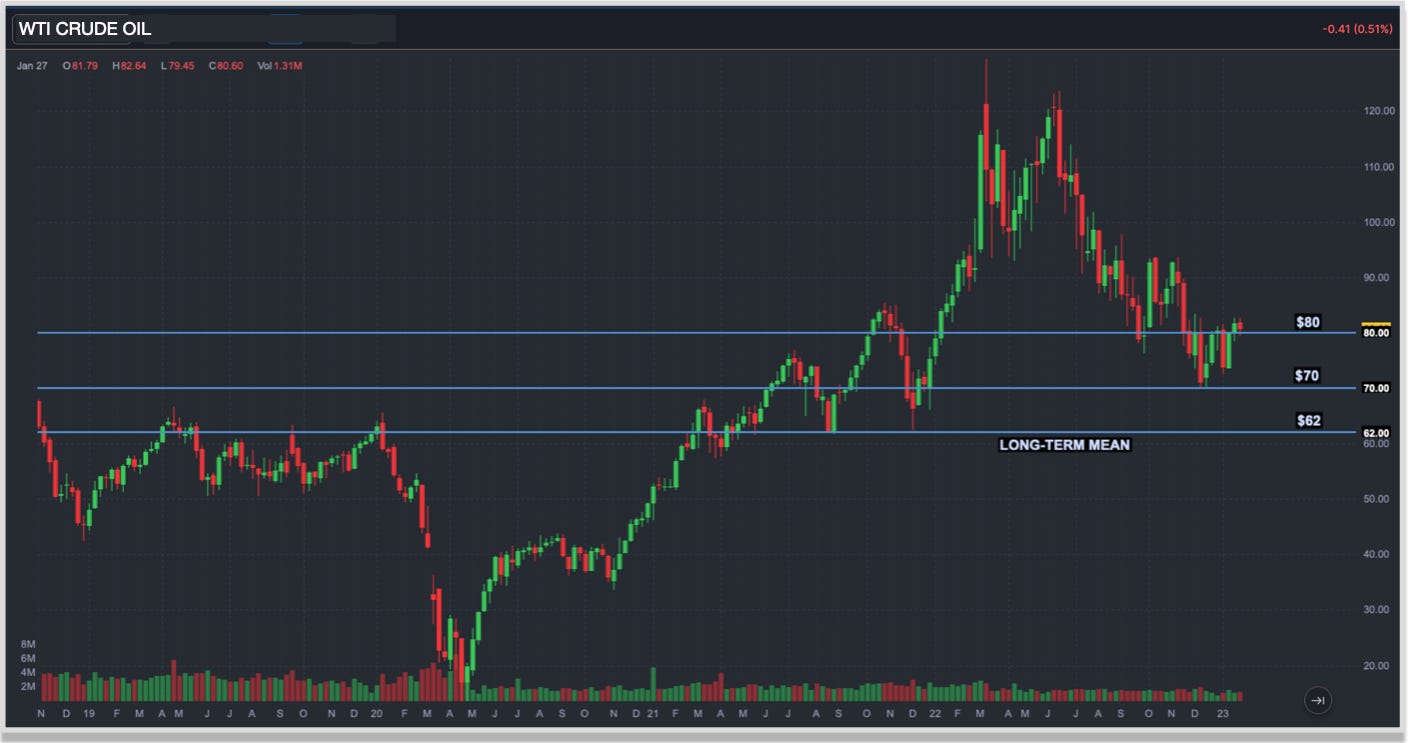
The midstream energy sector stocks (represented by MLPX in the chart below) continue to provide strong dividends with far less volatility than the oil price itself. In both charts we see the major covid-era selloff that affected all risk assets in March 2020.

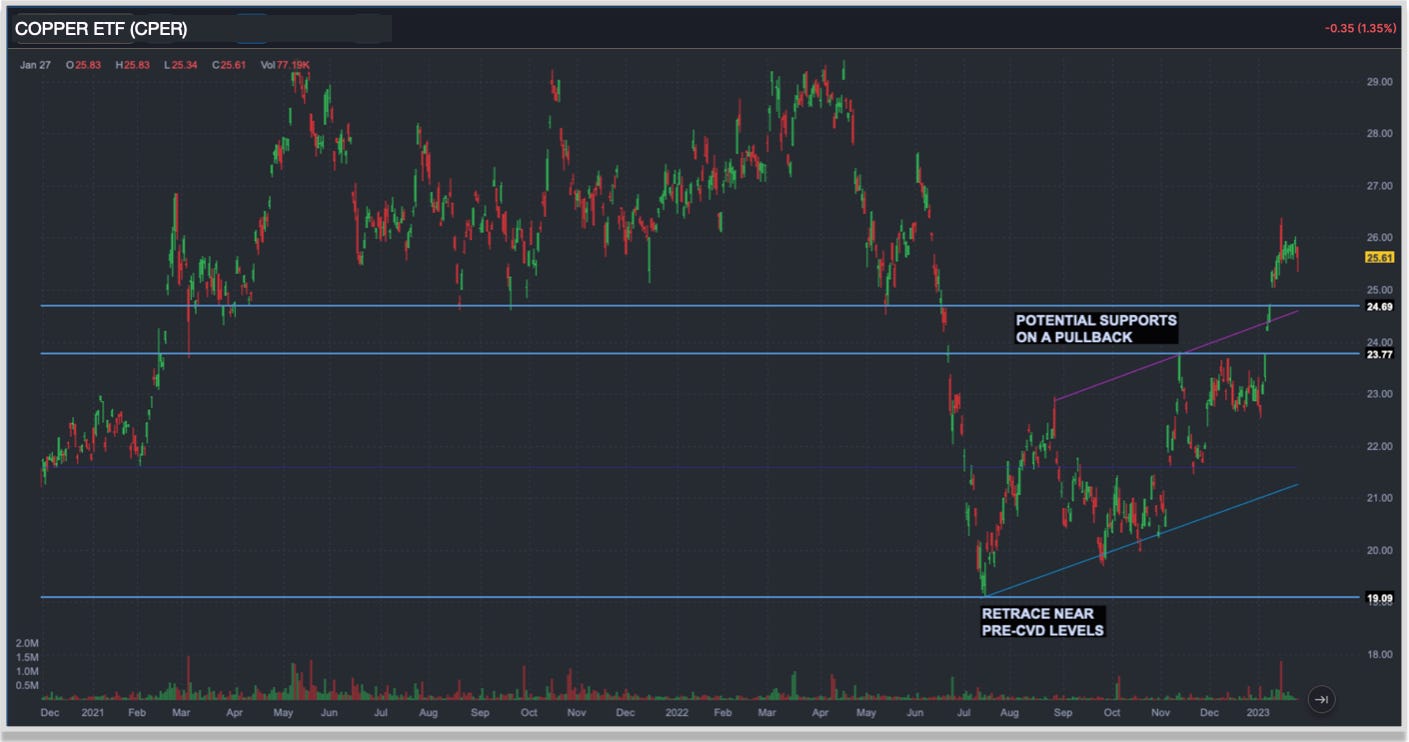
BASE METALS: (e.g., COPPER, ALUMINUM, ZINC)
Since October 2022, we have seen a significant rise in prices of both the base metal commodities and the companies who mine for them. The reopening of China, and in particular in support of their infrastructure initiatives, should continue to support these higher prices in the short term. In the medium term, if we are indeed walking into a recession I will be looking for a pullback to add to my positions in this sector.
PRECIOUS METALS: GOLD
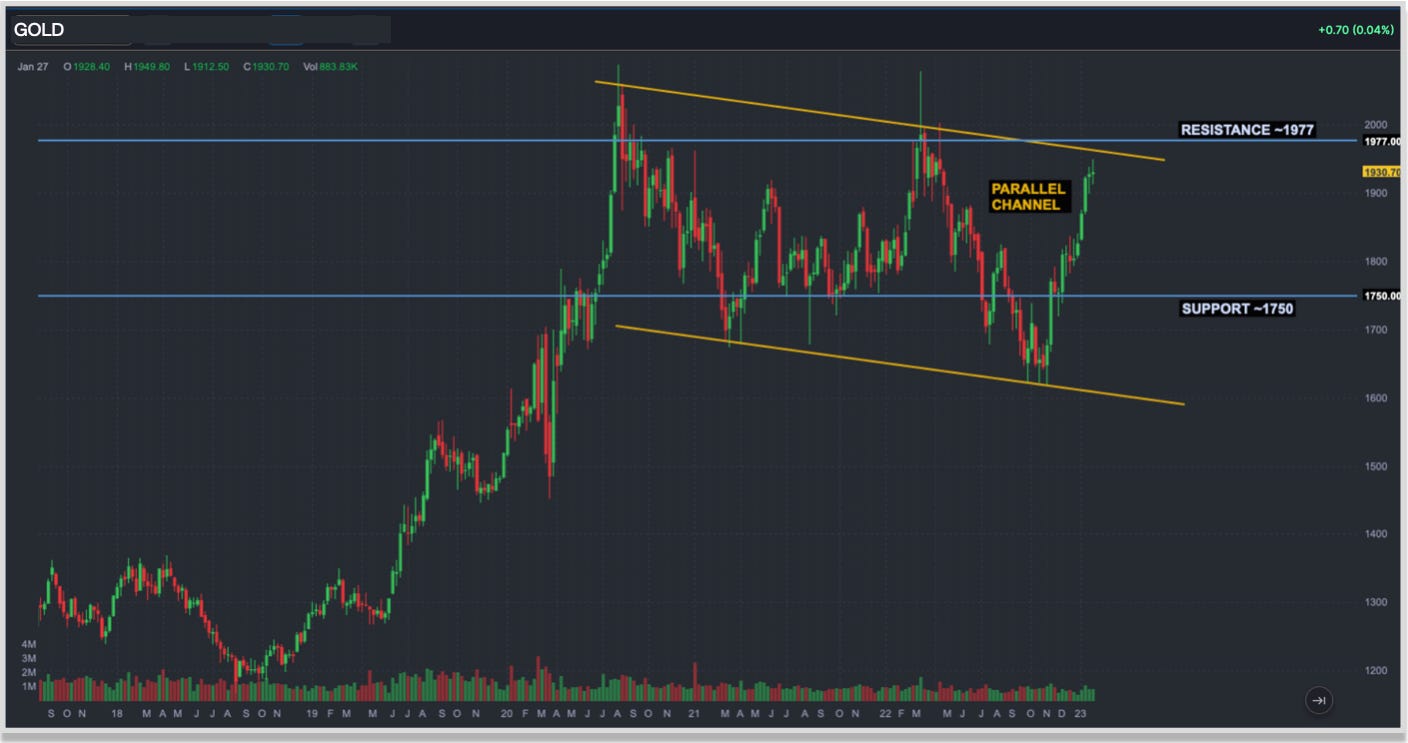
I continue to believe that gold may be the best performing asset in 2023. Primarily I own the physical metal, but I do hold a ‘trading position’ in my portfolio as you will see later in this article.
The gold price has been “melting up” since Nov 2022, perhaps prematurely pricing-in a Fed rate cut.
For the medium- and long-term I continue to be optimistic on gold as an eventual loosening of monetary policy should provide a big boost for precious metals. In the short-term however, the gold price has appreciated substantially as is likely due for a pullback.
BITCOIN
Currently I do not hold any crypto currencies. However I might be a buyer of Bitcoin once again at considerably lower levels. If BTC/USD drops below $15k I will start taking a look at it - my guess right now is that the price drops below $10k USD before the current bear market concludes. Pure speculation at this time.
IMPACTS FOR INVESTORS
Putting it all together, from both a fundamental and technical perspective, I see the following:
I expect US stock indexes to head lower over the course of 2023 — this is in accordance with the charts, the labor market, reduced liquidity in the financial system, and the Fed themselves basically telling us this is what they want. The precise timing of such ‘lower lows’ in the S&P 500 is anyone’s guess.
At some point, perhaps later this year on the back of what will eventually be a slightly more dovish Fed and a potential washout of bullish sentiment, both stocks and precious metals may begin a very strong multi-month bull market rally.
I believe 2022 was only the first year of what will be a multi-year secular bear market characterized by wild swings in both directions, creating a lot of opportunity for the active investor.
I continue to believe the best portfolio for this sort of environment is comprised of high quality dividend-paying stocks, select emerging market ETFs, US equity index shorts as needed to reduce volatility, precious metals, and a substantial amount of cash or short duration cash equivalents that can be put to work opportunistically.
And with that, let’s dig into my Portfolio!
The below portion of this newsletter is still being offered free of charge to all my readers. Please see my About page for subscription tiers coming March 1.
MY PORTFOLIO
PORTFOLIO OBJECTIVE
My portfolio is designed for a specific portion of my wealth and is constructed with a total return profile, seeking capital appreciation through both dividend income and growth. My portfolio has a very strong bias toward risk management and capital preservation with the goal of providing superior risk-adjusted returns.
ASSET ALLOCATION
To better understand my model portfolio and investing approach, I encourage you to refer back to both my Introduction and Opportunistic Tranche articles.
First we see my portfolio model in the chart here:

And my actual allocation in this next chart:

CURRENT HOLDINGS, as of Jan 30 pre-market
My current holdings are listed in the tables below. The right-most column shows position size as percent of total portfolio. My portfolio is actively managed, so any position you see here is subject to change at any moment and may not exist in my portfolio by the time you read this.
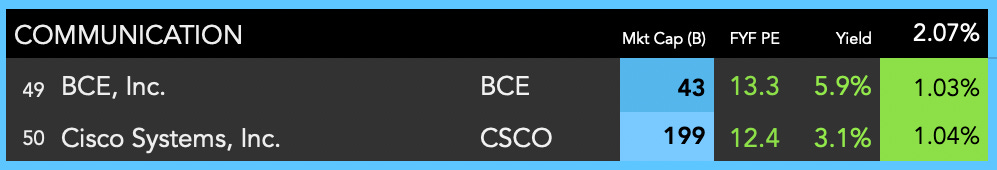
CORE EQUITIES
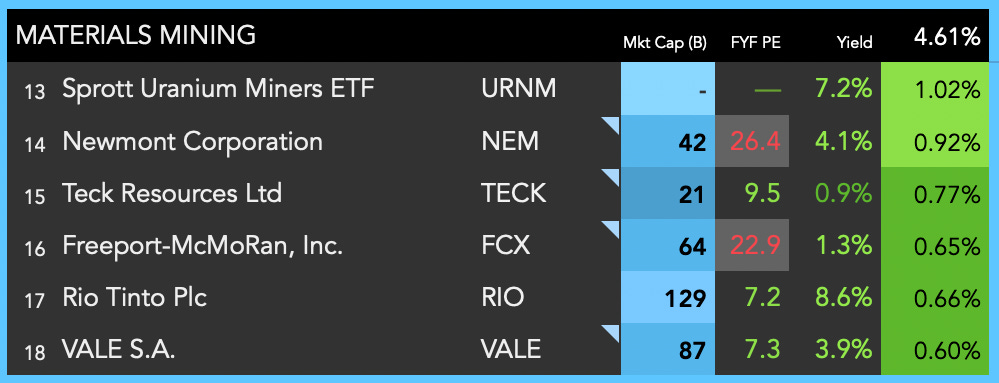
In each table below you will see my current stock holding, divided into sectors, with the size of the position & sector in the most-right column.


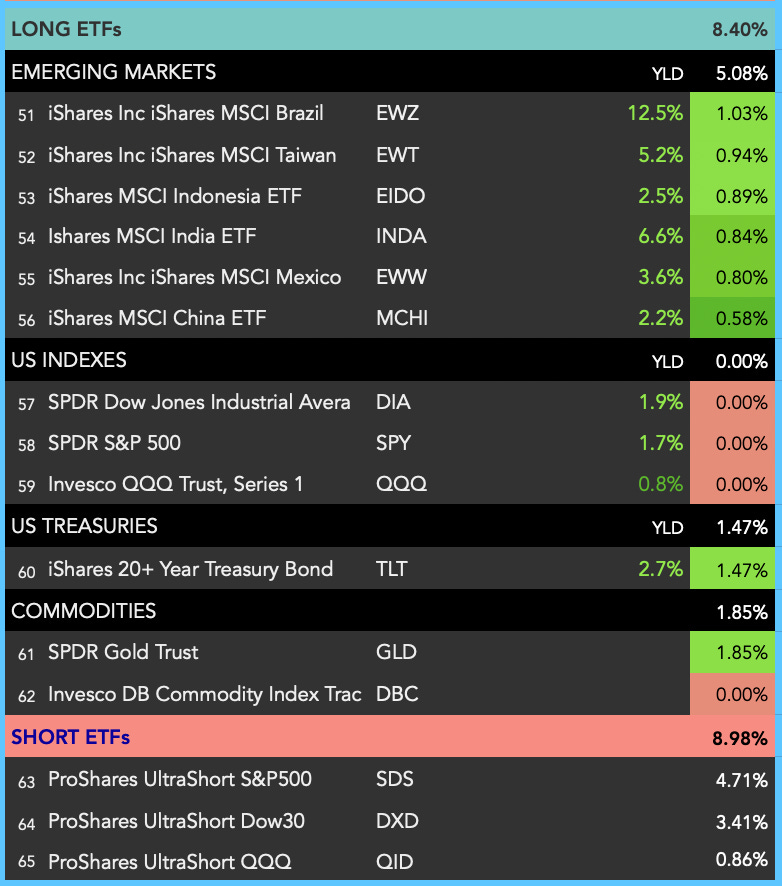
OPPORTUNISTIC TRANCHE
COMPOSITION HIGHLIGHTS
The chart below shows various metrics related to my portfolio.

RECENT TRADES
My trade details are outlined in the captions within the holdings tables above. To summarize at a higher level:
Overall I used cash to increased both my long and short exposure in January as I prepare for the next major market move, in one direction or the other.
My net-long exposure remains relatively unchanged (from 36% to 39%).
Positions closed in the past month: GS, NXST (I still love both, but had to make room for others)
New positions added to replace closed positions: RIO, WFC
What stands out to me in my portfolio right now is the TLT position which is very small. I would like to add considerably more if I feel a strong opportunity for interest rates to drop precipitously. With the FOMC meeting today, the time may soon be upon us, but I just don’t know yet. More to come.
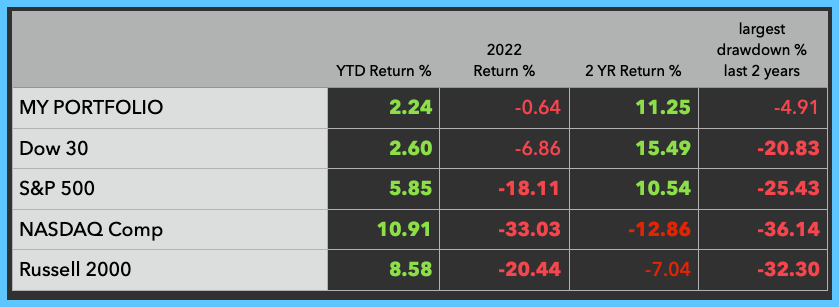
PERFORMANCE
My YTD performance is roughly inline with the DOW 30 as my underweighting in mega-cap stocks and overweight in shorts makes it hard to keep up with the other indexes during sharp rallies such as we saw in January. Overall I feel I am properly positioned for the current market environment.
ETF-ONLY ALTERNATIVE
If your preference is to avoid individual stocks and build an all-ETF portfolio, that may work well for you also. There is a big world of ETFs available out there and I know many people who have successfully constructed excellent portfolios in this manner.
If you would like help to better understand the ETF landscape please either seek the advice of a professional of your choice and/or visit my About page to contact me for more information.
Below is one version of an ETF-only portfolio intended to be similar-in-spirit to my portfolio, but of course this is far from an exact replica of holdings. However, this portfolio does contain similar proportions of sector and asset allocations as well as similar net-long exposure.
If you do not intend to be an active trader, simply skip the SDS (short) position and keep that money in cash. Nothing wrong with that at all.

IN CLOSING
To continue the discussion please comment, join my free Chat or visit my About page to contact me directly.

Great write up! Really appreciate the insight and broad coverage across all sectors and key themes that everyone is probably thinking about right now.
Thanks Tommy!
Good info on the Baltic Dry, I will check it out.
Cheers!
-F.