


The Big Portfolio Refresh, April 2023
Stock indexes soar on light volume, narrow breadth, bearish sentiment

On the first of each month I publish my big portfolio refresh to update my market outlook and discuss implications for my portfolio.
In this issue:
FOREWORD
SIGNIFICANT OBSERVATIONS
Narrow Market Breadth
Safe Havens
MARKET OUTLOOK
Overview
The Charts
MY PORTFOLIO
Portfolio Objective
Asset Allocation
Current Holdings
Composition Highlights
Recent Trades and Positioning
Performance
ETF-only Portfolio Alternative
FOREWORD
As I outlined in my previous post, the ‘crisis in confidence’ that arose from the recent baking turmoil resulted in significant technical changes to charts across all asset classes. As such, I have carefully reviewed each of my holdings taking gains where appropriate, paring back some higher-beta names, and in general reducing my overall allocation to risk assets while standing ready to increase exposure again should remaining bull-market sentiment quickly erode.
Later in this post I will address the specifics around my portfolio holdings, recent trades, and my revised market outlook. I will also share the performance of my portfolio in some detail to put the effects of my risk management overlay into context.
Let’s dig in…
SIGNIFICANT OBSERVATIONS
Market breadth narrows
As I wrote about in ‘Markets High on Passive Investing’ we are seeing extremely narrow market breadth with relatively few stocks performing well this year. Those few stocks, however, comprise the majority of the major US stock indexes meaning that ‘the market’ is seeing gains while most managed portfolios are not participating in that upside.
Let’s take a look at what’s going on here.
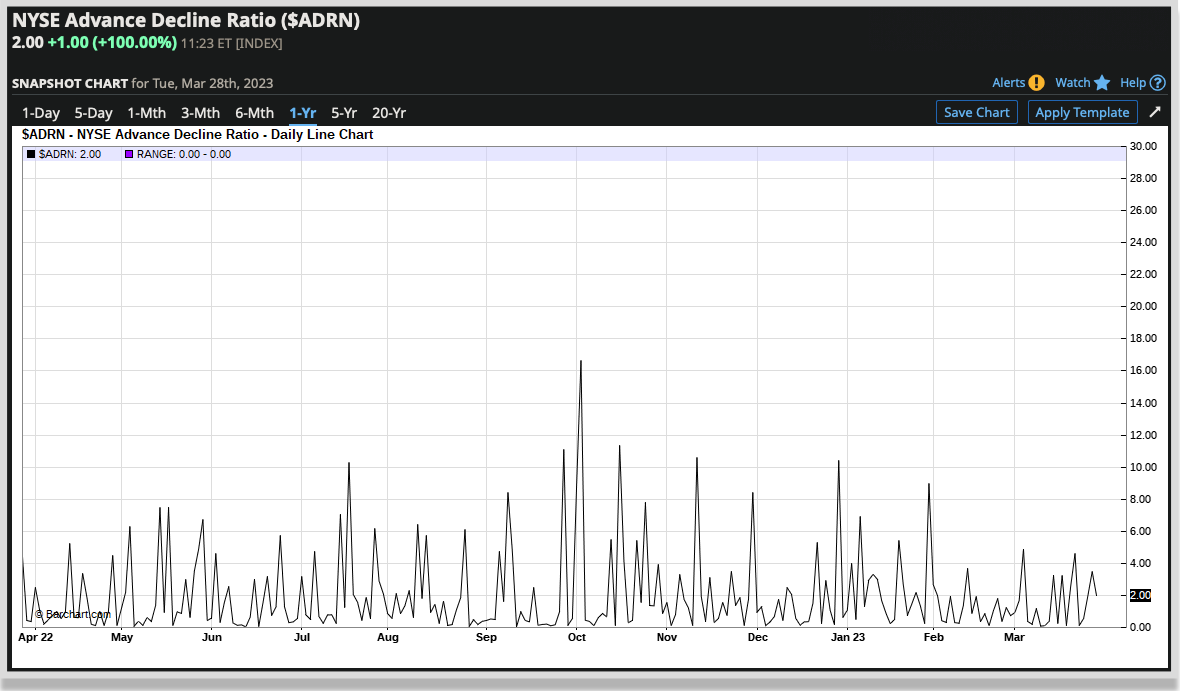
1. Advance-Decline is declining: In the chart below we can see how market breadth — as illustrated by the Advance-Decline Ratio — has been generally falling during the entire rally in the S&P 500 that started last October.
2. Light volume: In the chart below, we see that trading volume has been on a steep decline as Q1 comes to an end suggesting there may not be strong institutional participation in the current rally.

3. Bulls & Bears: We saw the Bull-Bear Spread crater in March with only a minor pullback in stocks.

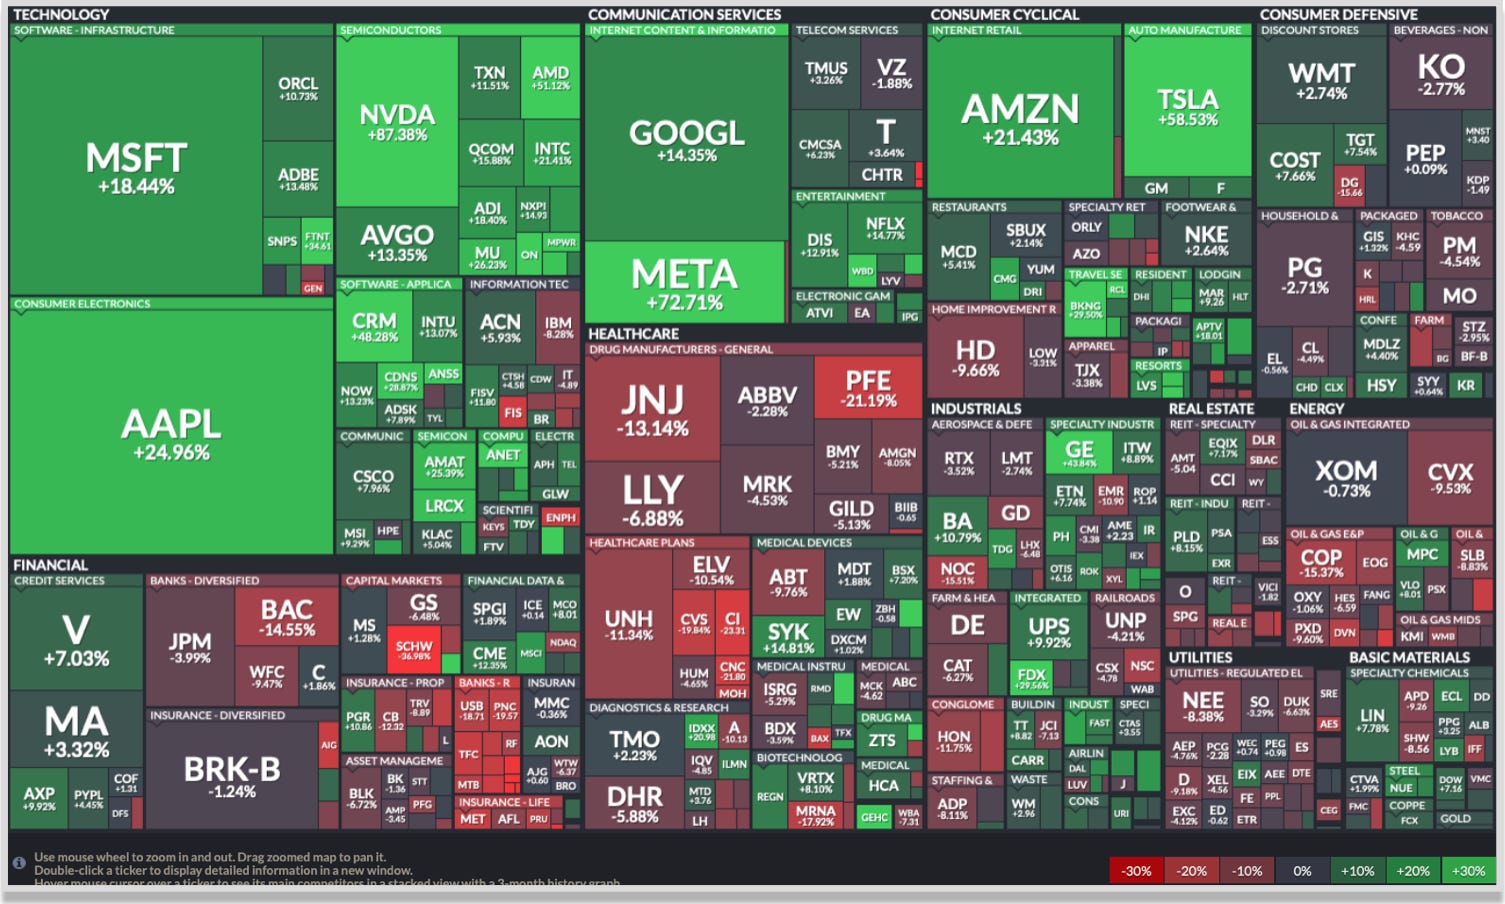
4. Top-heavy stock rally: Additionally we see in the chart below the year-to-date performance of each of the S&P 500 component stocks. Inline with the decreasing market breadth, we see that most of the upside has come from the largest companies in the Index.
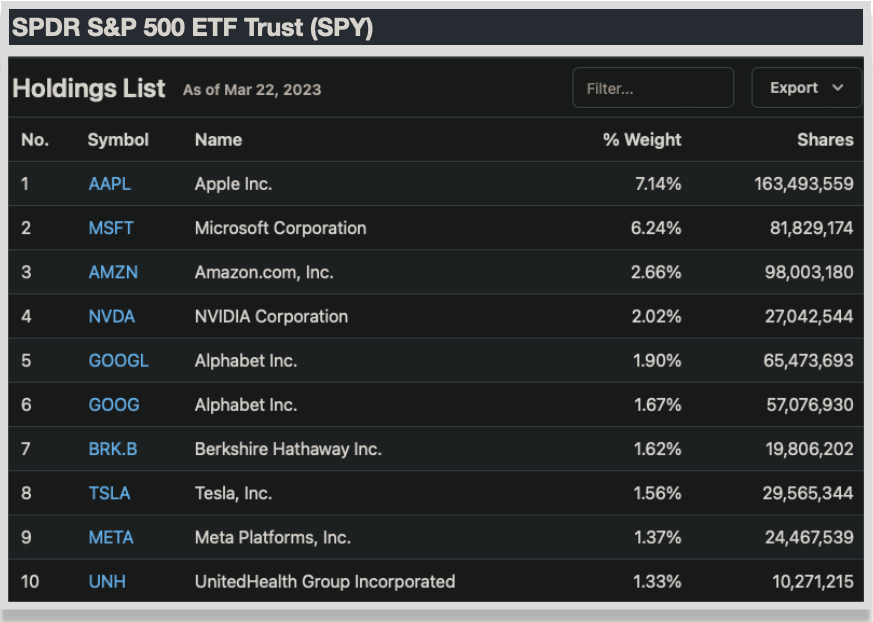
5. S&P 500 big tech weighting: As you will see below, 7 tech companies now represent 25% of the S&P 500 index. Those companies are Google (Alphabet), Apple, Microsoft, Nvidia, Tesla, Meta, Amazon.
6. NASDAQ Composite also top-heavy: Those same 7 companies represent a whopping 51% of the Q’s.

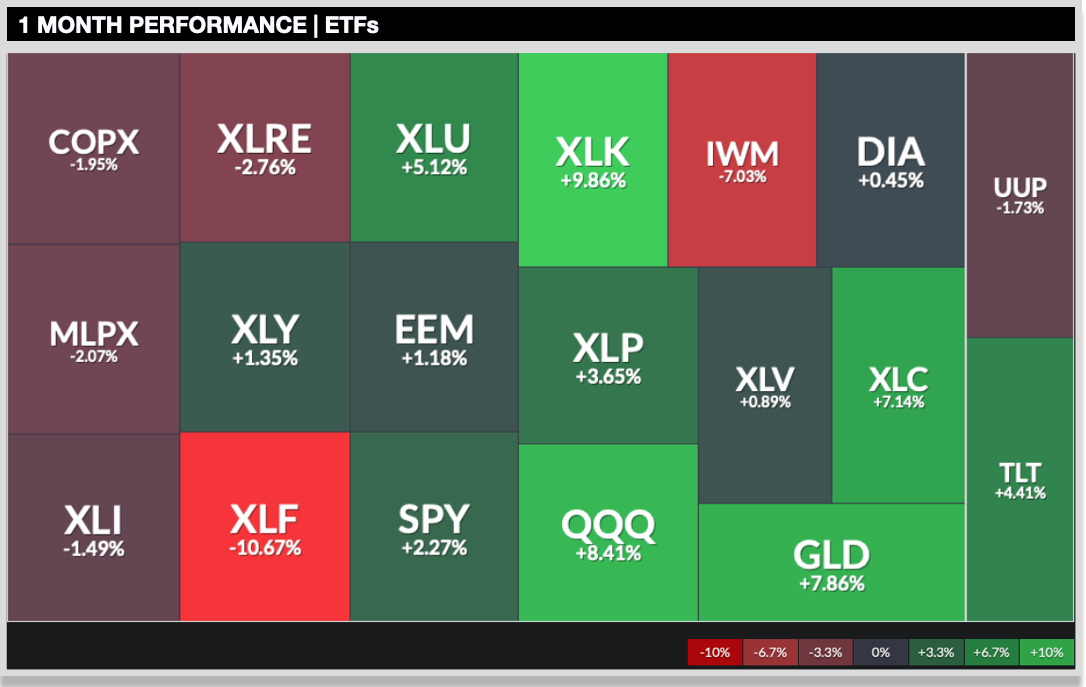
7. XLC, XLK and XLY dominate: In the first chart below we see that along with QQQ, Communications (XLC), Technology (XLK), and Consumer Discretionary (XLY) have significantly outperformed other sectors YTD (we’ll get to GLD and TLT later in this post).

And in the next chart below we see that XLC and XLK have really taken off over the past month.
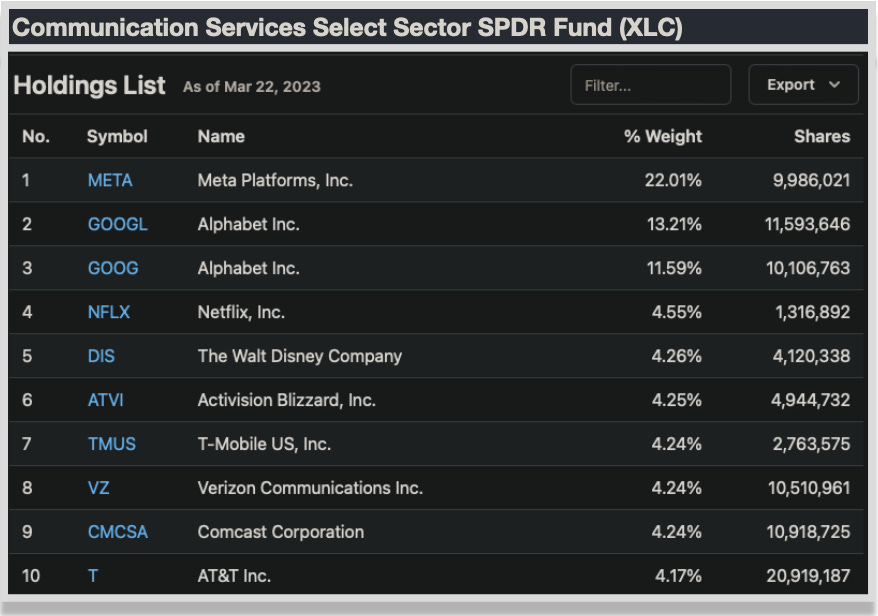
And here is the makeup of those 3 ETFs:
XLC: META and Google make up 47%
XLK: Microsoft, Apple and Nvidia make up 52%
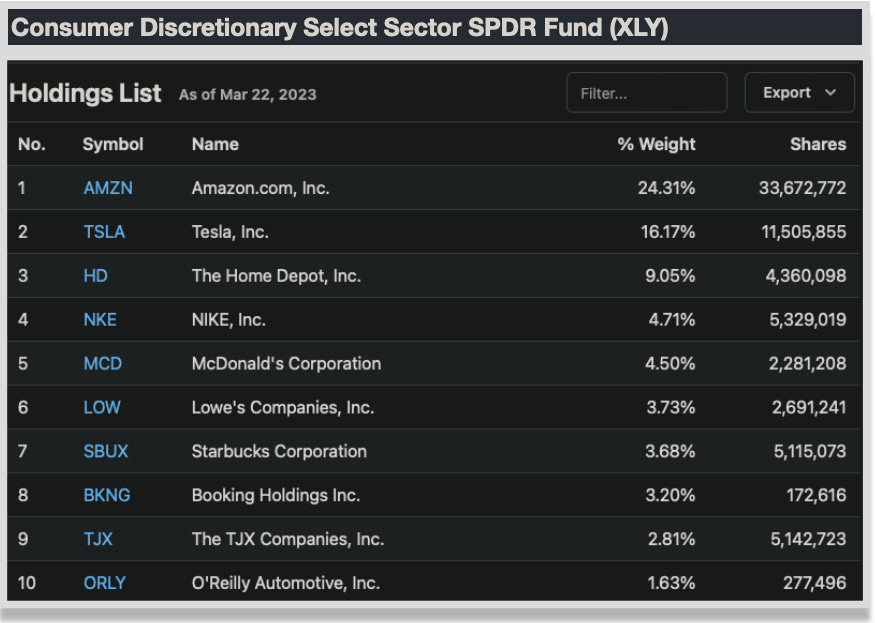
XLY: Amazon and Tesla make up 40%
To complete the picture I’ve included the tables below where we see the top 10 holdings for each of the 3 ETFs.

8. Old guard vs. big tech: The outperformance of Big Tech becomes very clear when compared with some of the more balanced equity ETFs such as Healthcare, Energy Midstream, Industrials and Utilities.


Apple, the largest stock in the world, is not far from its all time high. We will know this bear market is over when Apple finally pulls back toward its longer-term mean, maybe ~100. Clearly that’s not going to happen any time soon.
Safe Havens
Many people have asked me recently why Bitcoin and Apple stock have been acting as ‘safe havens’ during the recent banking fiasco which began around March 9.
Below is the approximate return for several ‘safe haven’ assets for the period March 9-23.
GLD +10.5% — Physical gold has always been money; GLD tracks the spot price of GOLD on the COMEX, but does not represent physical gold itself.
TLT +5.1% — US treasuries generate a risk-free return so long as you hold them until maturity, and may also appreciate when interest rates pull back. The ETFs such as TLT, IEF, SHY trade like stocks with no maturity date.
AAPL +5.2%. — Apple stock, PE ~27, P/S ~6.5, Yield ~0.6%
Bitcoin +45.9% — Yield 0%.
Money Market funds (currently yielding ~2-4% APY): These are short duration fixed income mutual funds.
While all of the above are great investing and trading tools, the only ones I would consider to be ‘save haven’ assets are physical gold, US Treasury bills held to maturity, and money market funds. If you see things differently I would enjoy hearing from you. Drop me a comment!
MARKET OUTLOOK & MY PORTFOLIO
“We’re trying to survive until the next bull market… We may be in the early stages of another financial crisis of some sort, and we don’t want to blow up our portfolios.”. — Darius Dale of 42Macro, March 2023
Last month, I wrote about the banking crisis of 2008 and how, for most people, it seemed to come out of nowhere though all the signs had been there for many months. Unbelievable timing with that article as it was published just prior to the current banking turmoil, though I wrote it only to help explain why I do what I do — total coincidence.
And while I am not predicting another 2008-style catastrophe, I am keenly aware of the extreme overvaluation of some of the largest US stocks, along with the many cracks in the foundation of our financial system. The recent issues with a few of the regional banks are symptoms of a larger problem that has been brewing for many years and is not going away any time soon.
However, with all that said, the party in stocks does not appear to be ending just yet. Perhaps we are heading toward new highs as a mania phase kicks in over the next few months. Or perhaps there is to be a bloodbath in stocks just around the corner.
Or maybe both of the above are true. I’ve heard calls for S&P 500 at 6,000 by end of summer, followed by a 70% crash taking the Index back to 1800. That could happen also. Best to be prepared for any eventuality in a manner that is sensible and well thought out.
Let’s review my latest market outlook and portfolio holdings to get some idea as to how I am prepared for whatever may come.
Twice-a-month I revise and publish my comprehensive market outlook along with the details of my portfolio (see table of contents above).
If you are not yet a paid subscriber you are welcome to view a recent free post to get an idea of the sort of detail I provide for my paid audience. For subscription tiers please click the button below or visit my About page.
Keep reading with a 7-day free trial
Subscribe to FiNiche Investments to keep reading this post and get 7 days of free access to the full post archives.